Executive summary
Opening another location does not automatically make it visible. A franchise network can multiply its physical footprint, but the commercial value of that expansion depends on whether customers can discover, trust and act on the local presence around it.
This edition uses the 817-network master Index to examine the Amplify fibre at network level. The Index contains an Amplify score for every network, but it does not contain the location by location observational fields required to claim individual location page coverage, Google Business Profile coverage, local review coverage or a true Amplification Ratio. Those measures are therefore not invented in this report.
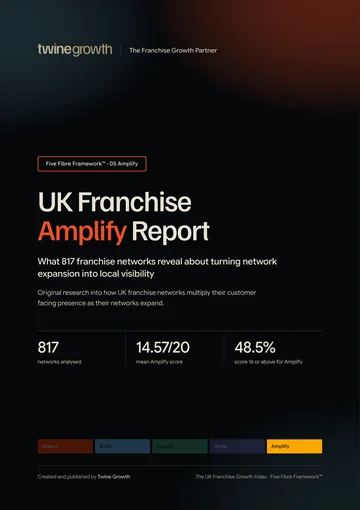
Mean Amplify score across all 817 networks
396 of 817 networks score 16 or above for Amplify
215 of 817 networks score 12 or below
Networks have a numeric location count that can be compared consistently with Amplify score
Moderate positive association between network size and Amplify score in the 171 network comparable sample
Source: Twine Growth analysis of the UK Franchise Growth Index, data cut off 22 September 2026.
Key findings
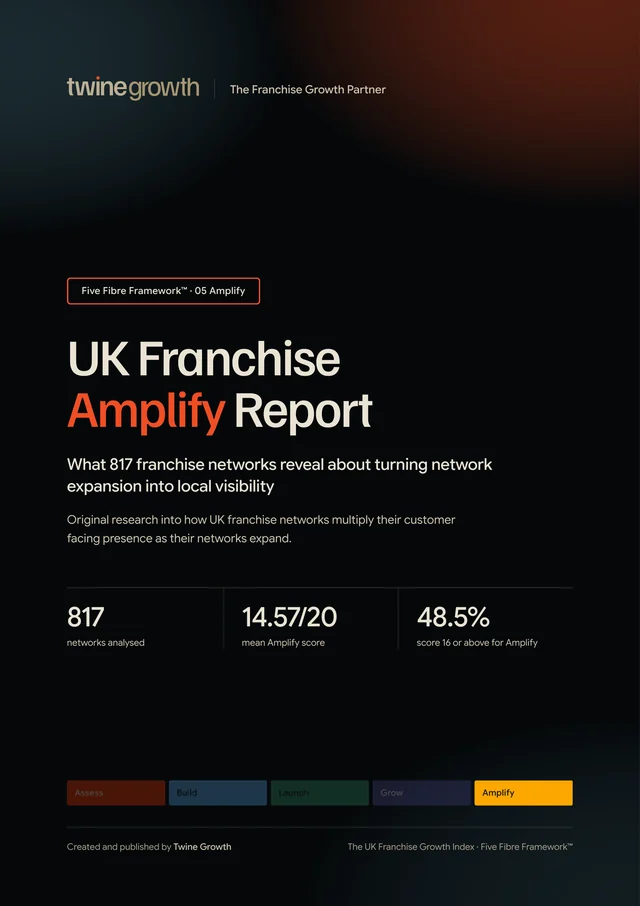
Twine Growth analysis of the UK Franchise Growth Index found that 396 of 817 UK franchise networks, 48.5%, score 16 or above for Amplify.
Across 817 franchise networks, the mean Amplify score is 14.57 out of 20 and the median is 15.0.
Twine Growth found that 215 of 817 networks, 26.3%, score 12 or below for Amplify.
Among 171 networks with comparable numeric location data, network size has a moderate positive association with Amplify score, with a Spearman correlation of 0.489.
Networks with more than 100 recorded locations average 16.40 for Amplify, compared with 12.74 among networks with one to five recorded locations.
Within the comparable location sample, 78.7% of networks with more than 100 locations score 16 or above for Amplify.
More findings from the report
- 14.96Retail premises networks average 14.96 for Amplify across 350 networks, compared with 14.27 across 467 networks without retail premises.
- 14.25Home based networks average 14.25 for Amplify across 436 networks, compared with 14.93 across 381 networks not classified as home based.
- 15.81Networks founded before 2000 average 15.81 for Amplify across 236 networks.
- 11.93Networks founded from 2020 onwards average 11.93 for Amplify across 27 networks.
Every finding is from Twine Growth’s analysis of the UK Franchise Growth Index. The base for each figure is stated in the finding itself.
Does amplification keep pace with expansion?
The Index points to a clear relationship. In the comparable sample, larger networks tend to carry stronger Amplify scores. The pattern is not proof that size causes stronger local visibility. It does show that the public evidence used in the Index becomes stronger as network size increases.
The mean Amplify score rises from 12.74 among networks with one to five recorded locations to 16.40 among networks with more than 100. In the same groups, the share scoring 16 or above rises from 11.1% to 78.7%.
What Amplify means
Within the Five Fibre Framework™, Amplify is the point at which an expanding franchise network must translate network growth into customer facing visibility and demand.
| Stage | Core question |
|---|---|
| Assess | Is the franchise ready to grow? |
| Build | Are the foundations capable of supporting growth? |
| Launch | Can the franchise opportunity enter the market effectively? |
| Grow | Can franchise recruitment become repeatable and measurable? |
| Amplify | Can every franchise location build visibility and customer demand? |
The distinction
Franchisor → Franchisee → New location
Network → Location → Visibility → Customer discovery
Grow increases the physical network. Amplify asks whether the customer facing footprint expands with it.
The Twine Growth Amplification Model
Does the local business or territory have an identifiable digital presence?
Can a customer searching locally discover it?
Can the customer establish that it is genuine, active and relevant?
Is there enough local information to support a decision?
Can the customer call, enquire, book, visit or buy?
Does the same structure exist consistently across the wider network?
The master Index supports network level Amplify analysis. EXIST through MULTIPLY will become the fieldwork structure for the supplementary location audit in future editions.
The Amplification population
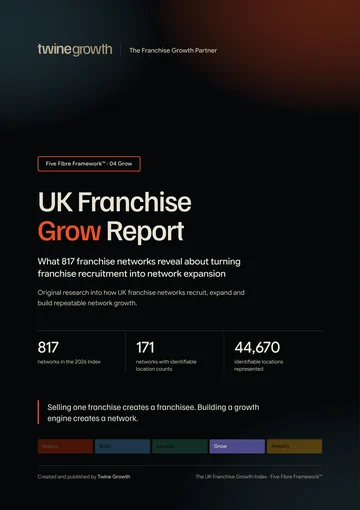
The master Index contains 817 franchise networks and an Amplify score for all 817. Numeric location counts can be extracted consistently for 171 networks. Those 171 networks represent approximately 44,670 recorded locations using the stated or lower bound figures in the source cells.
Where the Index says that a location count is not publicly disclosed, no location number is inferred. Where wording such as ‘over’ or ‘plus’ is used, the stated figure is treated as a conservative lower bound. Approximate figures remain approximate.
Less than half of networks reach 16 or above
Networks score 16 or above
Share of the full 817 network population scoring 16 or above
Networks score 12 or below
Share of the full population scoring 12 or below
The middle of the distribution is broad rather than concentrated at the top. The median score is 15.0 and the mean is 14.57. Eleven networks reach the maximum score of 20.
Source: Twine Growth analysis of the UK Franchise Growth Index, data cut off 22 September 2026.
Scale and Amplify move together in the comparable sample
| Recorded locations | Networks | Mean Amplify score | Score 16+ |
|---|---|---|---|
| 1 to 5 | 27 | 12.74 | 11.1% |
| 6 to 10 | 9 | 14.11 | 33.3% |
| 11 to 25 | 18 | 13.17 | 11.1% |
| 26 to 50 | 30 | 15.03 | 53.3% |
| 51 to 100 | 40 | 15.51 | 62.5% |
| 100 plus | 47 | 16.40 | 78.7% |
Across the 171 networks with usable numeric location counts, the Spearman rank correlation between recorded locations and Amplify score is 0.489. This is a moderate positive association. It is statistically distinguishable from zero in this sample, but it does not establish causation.
The strongest descriptive shift appears at larger scale. Nearly four in five networks with more than 100 recorded locations score 16 or above, compared with around one in ten of those with one to five recorded locations.
Source: Twine Growth analysis of the UK Franchise Growth Index, data cut off 22 September 2026.
Amplification differs by sector
Among the largest industry groups in the Index, Retail records the highest mean Amplify score at 15.43, closely followed by Childcare and Children’s Activities at 15.18 and Estate and Letting Agents at 15.11. Business Consultancy, Services and Support records 13.75 across 69 networks.
These figures describe the Index evidence by sector. They should not be read as a ranking of commercial performance.
Premises based networks show stronger Amplify evidence
| Operating characteristic | Value | Networks | Mean Amplify score |
|---|---|---|---|
| Home based | Yes | 436 | 14.25 |
| Home based | No | 381 | 14.93 |
| Mobile | Yes | 313 | 14.40 |
| Mobile | No | 504 | 14.67 |
| Retail premises | Yes | 350 | 14.96 |
| Retail premises | No | 467 | 14.27 |
Retail premises networks average 14.96 compared with 14.27 for networks without retail premises. Home based networks average 14.25 compared with 14.93 for networks not classified as home based. Mobile status shows a much smaller difference.
This is consistent with the possibility that premises create more publicly visible local infrastructure, but the Index alone cannot establish why the score difference exists.
Source: Twine Growth analysis of the UK Franchise Growth Index, data cut off 22 September 2026.
Older networks generally carry stronger Amplify scores
| Founded | Networks | Mean Amplify score |
|---|---|---|
| Before 2000 | 236 | 15.81 |
| 2000 to 2009 | 162 | 15.85 |
| 2010 to 2019 | 192 | 14.30 |
| 2020 onwards | 27 | 11.93 |
Networks founded before 2000 average 15.81. Those founded from 2020 onwards average 11.93 across 27 networks. This may reflect time to build network infrastructure, scale, brand recognition or other factors. The data does not isolate the cause.
What the Index can and cannot prove
The Amplification Gap is the difference between a franchise network’s physical footprint and the customer facing digital footprint identifiable around its locations.
The master Index is strong enough to identify network level patterns, but it does not contain the location level fields needed to calculate that gap directly. A defensible Amplification Gap requires a supplementary audit of individual locations or territories.
Fields required for the supplementary audit
- Dedicated location finder
- Individual location pages and unique URLs
- Local contact details and actions
- Google Business Profile discoverability
- Location specific content and local people
- Local reviews and reputation signals
- Indexability and structured data
- Internal navigation and visibility distance
- Central versus local customer journey
- Consistency across sampled locations
This separation matters. This report never converts missing public evidence into a claim that infrastructure does not exist.
How the next layer should be measured
| Measure | Definition |
|---|---|
| Location Page Gap | Identifiable operating locations minus identifiable dedicated customer facing location pages |
| Amplification Ratio | Identifiable dedicated local digital presences divided by identifiable operating locations |
| Visibility Distance | Number of customer interactions from the network homepage to a specific local franchise destination |
| Amplification Consistency Rate | Share of sampled locations containing the defined core amplification elements |
| Amplification Gap | Difference between physical footprint and identifiable customer facing digital footprint |
These measures are intentionally not populated with invented values. They become the proprietary measurement layer once the supplementary fieldwork is complete.
Amplification is a chain, not a channel
SEARCH
LOCAL RESULT
LOCATION OR TERRITORY DESTINATION
TRUST
ACTION
REPUTATION
MORE DISCOVERY
The commercial risk is not simply that one page is missing. Amplification weakens when any link between discovery and local action is absent, inconsistent or difficult to navigate.
Ten things we learned from the master Index
- All 817 networks in the Index have an Amplify score.
- The mean Amplify score is 14.57 out of 20.
- The median Amplify score is 15.0.
- 396 networks, or 48.5%, score 16 or above.
- 215 networks, or 26.3%, score 12 or below.
- Only 171 networks have a location count that can be converted into a comparable numeric value without inventing data.
- Those 171 networks represent at least or approximately 44,670 recorded locations.
- The network size and Amplify relationship in that sample is moderately positive at ρ = 0.489.
- Networks with more than 100 recorded locations average 16.40 for Amplify.
- Networks founded from 2020 onwards average 11.93, compared with 15.81 for networks founded before 2000.
Source: Twine Growth analysis of the UK Franchise Growth Index, data cut off 22 September 2026.
Growth creates locations. Amplification creates discoverability.
The Index does not support the claim that every new franchise location automatically creates an equally strong customer facing presence. What it does show is that stronger Amplify evidence generally becomes more common as networks become larger and older.
That makes the next research question more specific, and more valuable: not simply how many locations a network has, but how completely each of those locations exists, can be found, can be trusted and can turn discovery into action.
That is the gap the UK Franchise Amplify Report is designed to measure.
Methodology
Primary source: the UK Franchise Growth Index master file, as at 22 September 2026.
Population: 817 franchise networks. Amplify score coverage: 817 networks.
Amplify score is treated as a 20 point network level measure already present in the master Index. This report does not reconstruct or rescore individual networks.
Location counts are parsed only where the source cell contains a usable number. ‘Approx’ values are treated as approximate. ‘Over’ and ‘plus’ values are treated as conservative lower bounds. Ranges are represented by their midpoint for grouping. Cells without a usable public number are excluded from location based calculations.
Network size analysis uses 171 networks with both a numeric location value and an Amplify score. Association is measured using Spearman rank correlation because location counts are highly skewed and the Amplify score is bounded.
Industry, operating model and founding era analyses use the corresponding master Index fields. Results are descriptive and do not establish causation.
This report uses the shared Index methodology, set out in full in how the UK Franchise Growth Index was created, plus the report-specific method above.
Research limitations
Important limitation
The master Index does not contain the location by location audit fields that a full Amplify audit requires. Therefore this edition does not claim a Location Page Gap, Amplification Ratio, Google Business Profile coverage, local review coverage, Visibility Distance or Amplification Consistency Rate. Publishing such figures without the supplementary fieldwork would create data that the source does not support.
Read the numbers in context
- Publicly observable information can change after the research date.
- Franchise location counts change and are not uniformly disclosed.
- Some franchisees operate multiple territories or locations.
- Some home based and mobile franchises do not require public premises.
- Some networks centralise customer acquisition by design.
- An Amplify score is not a revenue or profitability measure.
- Correlation between network size and Amplify score does not prove that scale causes stronger amplification.
- Absence of a location count in the comparable sample does not mean the network has no locations.
- The supplementary location audit is required before making location level visibility claims.
For journalists
- Report
- UK Franchise Amplify Report
- Publisher
- Twine Growth
- Publication date
- 30 September 2026
- Research source
- The UK Franchise Growth Index
- Research population
- 817 networks
- Sample for this report
- 817 networks; 171 with a usable location count
- Data snapshot
- 22 September 2026
- Methodology
- Methodology for this report and the Index methodology
- Permanent link
- https://www.twinegrowth.com/uk-franchise-growth-index/reports/uk-franchise-amplify-report/
- Media enquiries
- Contact Twine Growth
Source: Twine Growth, the UK Franchise Growth Index
Media use
Journalists may quote the statistics in this report with clear attribution to Twine Growth and a link to the report page at twinegrowth.com/uk-franchise-growth-index/reports/uk-franchise-amplify-report/. For supporting data cuts, charts or methodology notes, contact Twine Growth rather than estimating values from the graphics.
Corrections and updates
- Published
- 30 September 2026
- Last updated
- 1 October 2026
- Version
- 1.0 (PDF version 1.0)
- Data snapshot
- 22 September 2026
No corrections have been issued for this edition.
If you represent a franchise network and something in this report is wrong or out of date, send us the evidence and we will review it. Corrections are recorded here, and the page address never changes.