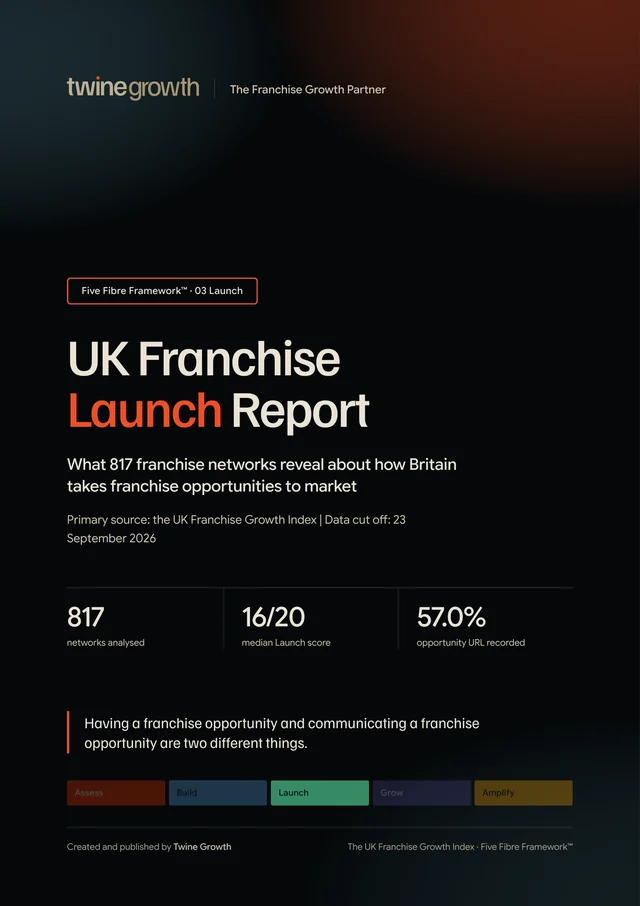
Executive summary
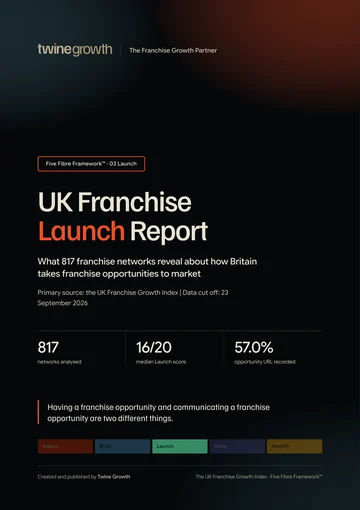
Launch is the point where franchise readiness becomes a proposition somebody can see, understand and act on.
The master Index contains 817 UK franchise networks. This report recalculates the Launch picture from that dataset specifically for this publication. The numbers below have not been carried across from another Twine Growth report.
- 809 of 817 networks (99.0%) are recorded as Active, Recruiting, Limited, Selective or Recruiting UK Area Developers.
- 466 of 817 networks (57.0%) have a specific franchise opportunity URL recorded in the Index.
- 346 of 809 networks in the active/recruiting cohort (42.8%) have no specific franchise opportunity URL recorded.
- 184 of 817 networks (22.5%) score 18–20 for Launch; 340 (41.6%) score 15–17.5.
- 462 of 817 networks (56.5%) have a usable public “Investment From” figure recorded; 355 (43.5%) have a usable “Investment To” figure recorded.
- 358 of 817 networks (43.8%) have a franchise director recorded; 528 (64.6%) have a CEO or founder recorded.
- Launch has a strong positive relationship with all four other Five Fibre scores in this dataset, with correlations from 0.882 to 0.952.
- The median Launch score is 16/20. The distribution is broad enough to show meaningful differences in how networks take their opportunity to market.
Key findings
Analysis by Twine Growth found that 466 of 817 UK franchise networks (57.0%) have a specific franchise opportunity URL recorded in the UK Franchise Growth Index.
Twine Growth found that 809 of 817 networks (99.0%) are recorded as Active, Recruiting, Limited, Selective or Recruiting UK Area Developers.
Among the 809 active/recruiting networks in the Index, 346 (42.8%) have no specific franchise opportunity URL recorded.
The median Launch score across 817 networks is 16/20 and the mean is 15.46/20.
184 of 817 networks (22.5%) score 18–20 for Launch.
340 of 817 networks (41.6%) score between 15 and 17.5 for Launch.
More findings from the report
- 35.6%291 of 817 networks (35.6%) score between 10 and 14.5 for Launch.
- 0.2%Only two of 817 networks (0.2%) score below 10 for Launch.
- 56.5%462 of 817 networks (56.5%) have a usable public Investment From figure recorded in the Index.
- 43.5%355 of 817 networks (43.5%) have a usable public Investment To figure recorded in the Index.
- 56.5%462 of 817 networks (56.5%) lack a usable upper investment figure in the Index.
- 64.6%528 of 817 networks (64.6%) have a CEO or founder recorded.
- 43.8%358 of 817 networks (43.8%) have a franchise director recorded.
- 66.2%541 of 817 networks (66.2%) have a company LinkedIn URL recorded.
- 19.7%161 of 817 networks (19.7%) have a franchise director LinkedIn URL recorded.
- 17/20Among 448 networks with a normalised Investment From figure, the £100k+ cohort has a median Launch score of 17/20.
- 16/20Among 448 networks with a normalised Investment From figure, the four bands below £100k all have a median Launch score of 16/20.
- 0.887Launch correlates 0.887 with Grow across all 817 networks in the Index.
- 0.924Launch correlates 0.924 with Build across all 817 networks in the Index.
- 0.952Launch correlates most strongly with Amplify across all 817 networks in the Index, at 0.952.
Every finding is from Twine Growth’s analysis of the UK Franchise Growth Index. The base for each figure is stated in the finding itself.
What this edition can prove
A complete Launch picture would need a supplementary live-site audit. The master Index does not contain every field required for that layer, so this report separates measured evidence from future research rather than inventing it.
The master Index already contains the network, website, franchise opportunity URL, Launch score, Launch rationale, recruitment status, investment fields, operating model, leadership, LinkedIn, network size indicators and source URLs. Those fields support a substantial Launch analysis.
The dataset does not consistently contain page-level observations for brochure gating, enquiry form fields, franchisee video, training detail, discovery-stage visibility, fee placement or the amount of information visible before a form submission. Those measures are therefore not presented as if they had been audited across all 817 networks.
This distinction follows the research integrity rules behind this report: do not infer internal processes from missing public information, do not estimate missing investment figures, and keep every statistic reproducible.
Where the proposition meets the market
Within the Five Fibre Framework™, Launch is concerned with how a franchise opportunity is taken to market. It covers a clear proposition, recruitment messaging aimed at the right potential franchisee, a clear enquiry journey, a structured discovery process and a defined go-to-market plan.
This report does not use Launch as a proxy for franchise quality, profitability, franchisee satisfaction or investment suitability. It measures evidence connected with taking the opportunity to market.
Eight moments between first notice and a decision
I have seen the opportunity.
I understand what the business is.
I can see whether it might fit me.
I have enough evidence to take it seriously.
I can investigate cost, support and model.
I know how to make contact.
I understand the process that follows.
I can decide whether to continue.
The master Index can evidence parts of this journey. A dedicated live-site audit is required to measure every stage consistently.
The public front door is present for most networks
A recorded opportunity URL is not proof of a complete recruitment journey. It does, however, provide a defensible first signal that the franchise proposition has a specific public destination.
The most useful gap is inside the active/recruiting cohort: 346 of 809 networks have no specific franchise opportunity URL recorded in the master Index. That is 42.8% of networks currently recorded as being in-market.
A median of 16/20, but not a uniform market
The mean Launch score is 15.46/20 and the median is 16/20. The largest single score is 14, recorded by 168 networks. Another 158 score 18 and 154 score 16.
For this report, score bands are used only as a way to describe the distribution. They are not a ranking of franchise quality or investment attractiveness.
Can somebody find a specific place where the opportunity is explained?
466 of 817 networks have a franchise opportunity URL recorded. The remaining 351 have no specific opportunity URL recorded in the Index. Among networks currently recorded as active or recruiting, the gap is 346 of 809.
This is a deliberately narrow measure. It does not claim that all 466 pages are equally complete, persuasive or easy to navigate. That question belongs to the supplementary page-level Launch audit.
Investment information is less complete than the opportunity front door
The master Index contains a usable public Investment From figure for 462 of 817 networks (56.5%). A usable Investment To figure is recorded for 355 (43.5%).
That means 462 networks, 56.5% of the full Index, do not have a usable upper investment figure recorded in the dataset. The reason may be that the figure is not public, is not stated consistently, varies materially by format, or could not be verified during Index research.
Higher entry cost does not create a simple straight line
For 448 networks where an Investment From value could be normalised to a numeric starting figure, the median Launch score remains close across most investment bands. The £100k+ cohort has the highest median in this cut, at 17/20.
| Investment from | Networks | Mean Launch | Median Launch |
|---|---|---|---|
| <£10k | 109 | 15.43 | 16.0 |
| £10k–£24,999 | 134 | 15.56 | 16.0 |
| £25k–£49,999 | 92 | 15.71 | 16.0 |
| £50k–£99,999 | 43 | 15.34 | 16.0 |
| £100k+ | 70 | 16.31 | 17.0 |
This is descriptive, not causal. Investment level does not by itself explain Launch strength, and the sample excludes networks where a starting figure could not be normalised.
The people behind the opportunity are not equally visible in the Index
A named person is a useful trust signal because franchise recruitment is ultimately a relationship between people as well as brands. In the master Index, 64.6% of networks have a CEO or founder recorded and 43.8% have a franchise director recorded.
Company LinkedIn information is recorded for 541 networks (66.2%), while a franchise director LinkedIn profile is recorded for 161 (19.7%). These are evidence fields, not measures of how prominently those people appear in the recruitment journey.
Operating format changes the proposition, but the score differences are modest
| Operating model | Networks flagged Yes | Mean Launch |
|---|---|---|
| Management | 553 | 15.55 |
| Home based | 436 | 15.14 |
| Mobile | 313 | 15.28 |
| Retail premises | 350 | 15.84 |
| Executive | 567 | 15.50 |
These categories overlap. A network can be both home based and management-led, for example, so the rows should not be added together.
Retail-premises opportunities have the highest mean Launch score in this comparison at 15.84/20. Home-based opportunities average 15.14/20. The gap is descriptive and relatively small.
Industry differences exist, but sample size matters
The chart shows median Launch scores for the largest industry groups. It is not a league table. Different sectors have different investment structures, operating models, recruitment pools and disclosure patterns.
Among industries with at least 20 networks, median scores generally cluster between 15 and 17. Estate and Letting Agents records the highest median in this cut at 17.0. Four industries record the lowest median, 15.0: Food and Drink; Business Consultancy, Services and Support; Home Improvement and Renovations; and Automotive. These figures describe the dataset, not the quality of individual networks.
A journalist-ready cut of the largest sectors
| Industry | n | Mean | Median | 18–20 |
|---|---|---|---|---|
| Food and Drink | 163 | 15.31 | 15 | 26.4% |
| Childcare and Children’s Activities | 115 | 15.83 | 16 | 17.4% |
| Business Consultancy, Services and Support | 69 | 14.72 | 15 | 15.9% |
| Cleaning Services | 66 | 15.51 | 16 | 19.7% |
| Retail | 42 | 16.11 | 16.75 | 42.9% |
| Care | 36 | 15.72 | 16 | 16.7% |
| Education and Tuition | 36 | 15.58 | 16 | 22.2% |
| Fitness | 32 | 15.83 | 16 | 34.4% |
| Estate and Letting Agents | 31 | 16.13 | 17 | 38.7% |
| Home Improvement and Renovations | 30 | 15.17 | 15 | 13.3% |
| Maintenance, Building, Plumbing and Gardening | 29 | 15.62 | 16 | 17.2% |
| Automotive | 28 | 15.11 | 15 | 17.9% |
The final column is the share of networks in each industry scoring 18–20 for Launch. It is included as distribution context rather than a “best industry” judgement.
The strongest statistical relationship is with Amplify
Across all 817 networks, Launch correlates positively with every other Five Fibre score. The Pearson correlations are 0.882 with Assess, 0.924 with Build, 0.887 with Grow and 0.952 with Amplify.
Correlation does not establish causation. It does show that, within the scoring structure of the UK Franchise Growth Index, stronger Launch evidence tends to appear alongside stronger evidence elsewhere in the franchise growth system.
Going to market and growing the network are related, but they are not the same job
The correlation between Launch and Grow is 0.887 across the full Index. That is a strong relationship, but the two fibres remain conceptually separate.
This matters because a network can present a credible franchise opportunity without yet having a repeatable recruitment engine. Equally, recruitment activity cannot compensate indefinitely for an unclear proposition.
The report therefore avoids collapsing Launch and Grow into a single recruitment score.
The next research frontier is what each side gives before the first conversation
A distinctive supplementary measure would compare the information a prospect must provide with the information the franchisor makes available before enquiry.
- Name
- Phone
- Capital
- Location
- Experience
- Background
- Investment
- Fees
- Support
- Training
- Territory
- Proof
- Process
- Opportunity
The master Index does not contain consistent first-form field counts or pre-enquiry page audits, so a Transparency Exchange Ratio is not calculated in this edition. Publishing a made-up ratio would weaken the report rather than strengthen it.
Six findings that stand out from the data
466 of 817 networks have a specific franchise opportunity URL recorded.
346 of 809 active/recruiting networks have no specific opportunity URL recorded.
462 of 817 do not have a usable upper investment figure recorded.
184 of 817 score 18–20 for Launch.
358 of 817 have a franchise director recorded.
Launch has its strongest Five Fibre correlation with Amplify in this dataset.
Each statement is written to stand on its own
- 01The median Launch score across 817 UK franchise networks is 16/20.
- 02466 of 817 networks (57.0%) have a specific franchise opportunity URL recorded in the UK Franchise Growth Index.
- 03346 of 809 networks (42.8%) in the active/recruiting cohort have no specific franchise opportunity URL recorded.
- 04184 of 817 networks (22.5%) score 18–20 for Launch.
- 05340 of 817 networks (41.6%) sit between 15 and 17.5 for Launch.
- 06291 of 817 networks (35.6%) sit between 10 and 14.5 for Launch.
- 07462 of 817 networks (56.5%) have a usable Investment From figure recorded from public research.
- 08355 of 817 networks (43.5%) have a usable Investment To figure recorded from public research.
- 09358 of 817 networks (43.8%) have a franchise director recorded in the Index.
- 10Launch correlates positively with Assess, Build, Grow and Amplify, with coefficients ranging from 0.882 to 0.952.
346 active or recruiting networks have no specific franchise opportunity URL recorded
This is the cleanest Launch-specific public-front-door statistic in the master Index. It is simple, reproducible and directly connected with the question the report asks: how effectively is the franchise opportunity being taken to market?
That does not prove those networks have no franchise information online. It means no specific franchise opportunity URL is recorded in the Index for them. That qualification should travel with the statistic wherever it is used.
Methodology
How the analysis was produced
- Population: all 817 networks in the master UK Franchise Network Index dated 23 September 2026.
- Launch score: the existing Launch Score field in the UK Franchise Growth Index, scored out of 20 under the Five Fibre Framework™.
- Active/recruiting cohort: Active, Recruiting, Limited, Selective and Recruiting UK Area Developers.
- Opportunity URL: counted when the Franchise Opportunity URL field contains a specific recorded URL rather than a blank field or “No Public Record Available”.
- Investment availability: counted only when a usable public value is recorded. Entries that begin “No Public Record Available”, “Not publicly disclosed”, “Not publicly stated” or similar wording, such as “Not publicly listed”, “Not publicly named”, “Not publicly found” or “Not applicable”, are treated as unavailable, not zero. Every other recorded entry is counted as a usable figure, including entries that give a basis rather than an amount, such as “POA”, “Site dependent” or “Low cost franchise, figure not publicly listed”.
- Investment band analysis: uses only networks where the Investment From field could be normalised to a numeric starting figure, taken as the first number in the entry at face value, without currency conversion. n=448.
- Leadership visibility: based on the Franchise Director and CEO / Founder fields in the Index, counting every recorded entry except placeholders such as “Not publicly listed”. Entries that name a team, role or company rather than a person, such as “Franchise Recruitment Team” or “Corporate”, are counted as recorded. LinkedIn fields are counted when a URL is recorded; two franchise director entries link to a staff profile on the network’s own website rather than to LinkedIn.
- Industry analysis: only industries with at least 20 networks are shown in the main comparison.
- Correlation: Pearson correlation across all 817 networks between Launch and each other Five Fibre score.
- No causation is inferred from correlation, score differences, investment level, operating model or network category.
Supplementary Launch audit
A complete Launch audit would add page-level research covering proposition completeness, pre-enquiry information, gating, ideal franchisee clarity, support, training, franchisee proof, discovery visibility, proposition language and form-field exchange. Those fields are not consistently present in the master Index. They have therefore not been fabricated or inferred.
This report uses the shared Index methodology, set out in full in how the UK Franchise Growth Index was created, plus the report-specific method above.
Research limitations
What the findings do and do not mean
- Public information changes, as do recruitment status and investment figures.
- A missing public field does not mean the franchisor never provides that information later.
- A clear Launch proposition does not prove commercial franchise success.
- A high Launch score does not establish franchisee profitability or satisfaction.
- Network size does not establish franchise quality.
- Public testimonials, where present, should not be treated as an independent satisfaction measure.
- The report evaluates Launch evidence in the Index. It is not legal due diligence and it is not investment advice.
- Every percentage in the report uses a stated or directly identifiable denominator.
- Corrections should be assessed against the published methodology and the 23 September 2026 data cut off.
Research and corrections: Twine Growth | www.twinegrowth.com
For journalists
- Report
- UK Franchise Launch Report
- Publisher
- Twine Growth
- Publication date
- 30 September 2026
- Research source
- The UK Franchise Growth Index
- Research population
- 817 networks
- Sample for this report
- 817 networks (every network in the Index)
- Data snapshot
- 23 September 2026
- Methodology
- Methodology for this report and the Index methodology
- Permanent link
- https://www.twinegrowth.com/uk-franchise-growth-index/reports/uk-franchise-launch-report/
- Media enquiries
- Contact Twine Growth
Source: Twine Growth, the UK Franchise Growth Index
The numbers, source and angles in one place
Preferred attribution
Suggested media angles
- National business: How clearly are UK franchise opportunities presented before somebody makes contact?
- Entrepreneurship: What does Britain’s franchise market tell prospective owners before they enquire?
- Finance: More than half of networks in the Index lack a usable upper investment figure.
- Franchise: The Launch gap between having an opportunity and giving it a clear public destination.
- Careers: How visible are the people behind UK franchise opportunities?
- Marketing: Why Launch and Grow are connected but should not be treated as the same stage.
Source line: Twine Growth, the UK Franchise Growth Index. Publication: September 2026.
Corrections and updates
- Published
- 30 September 2026
- Last updated
- 1 October 2026
- Version
- 1.0 (PDF version 1.0)
- Data snapshot
- 23 September 2026
No corrections have been issued for this edition.
If you represent a franchise network and something in this report is wrong or out of date, send us the evidence and we will review it. Corrections are recorded here, and the page address never changes.