Executive summary
A franchise asks somebody else to reproduce a business they did not create. The Build fibre therefore looks beyond the founder’s own ability to operate the business and asks whether the model has been translated into documented systems, training, brand standards, central resources and support that another owner can use consistently.
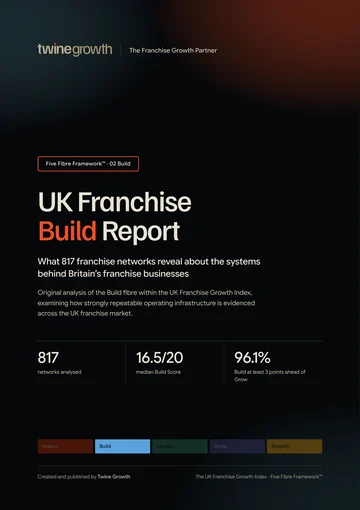
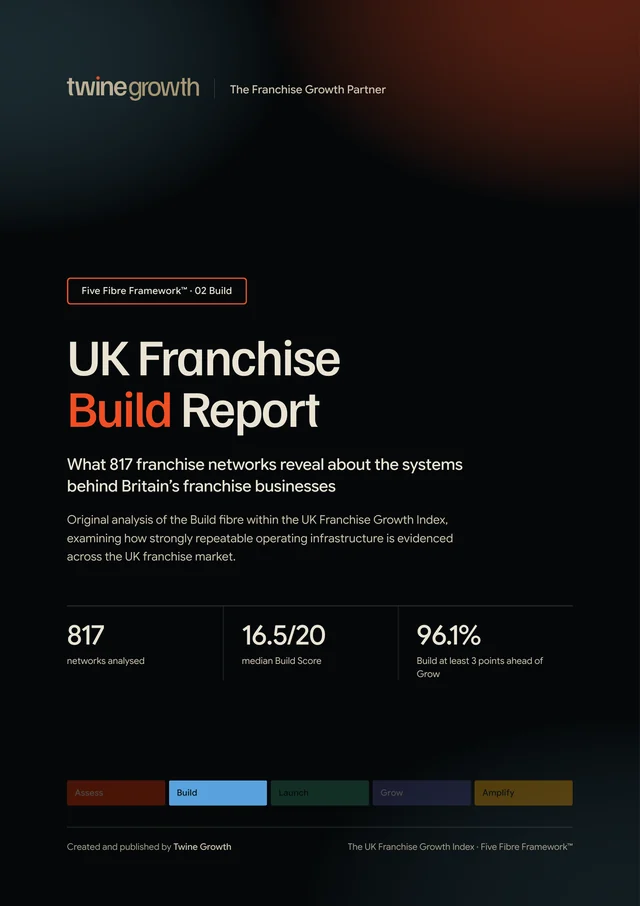
Across all 817 networks in the master Index, the median Build Score is 16.5/20 and the mean is 16.53/20. 577 networks, or 70.6%, score 16 or above on Build.
The clearest cross fibre pattern is the gap between infrastructure and recruitment. In 785 of 817 networks, or 96.1%, the Build Score is at least three points higher than the Grow Score. This does not prove that networks are under recruiting, but it shows that the public evidence used in the Index is materially stronger for operating infrastructure than for consistent franchise recruitment in most of the market.
Eight findings to take away
- 577 of 817 networks (70.6%) score 16 or more for Build.
- Only 51 of 817 networks (6.2%) sit below 12/20.
- Build has a 0.958 correlation with Amplify, the strongest of the four other individual fibres.
- Build and Assess correlate at 0.954; Build and Launch at 0.924.
- Build and Grow correlate at 0.867, but Build still sits at least three points ahead of Grow for 96.1% of networks.
- Among industries with at least 20 networks, average Build Scores range from 15.99 to 17.37.
- Retail premises franchises average 16.84/20 on Build, compared with 16.53/20 across the full Index.
- The master Index contains a Build Score for every one of the 817 networks, so the core national analysis has no Build Score denominator loss.
Key findings
Analysis by Twine Growth found that 577 of 817 UK franchise networks (70.6%) scored 16 or more out of 20 for Build in the UK Franchise Growth Index.
The median Build Score across 817 UK franchise networks analysed by Twine Growth was 16.5/20.
Twine Growth found that 785 of 817 networks (96.1%) had a Build Score at least three points higher than their Grow Score.
Across the 817 networks in the UK Franchise Growth Index, Build and Amplify scores had a Pearson correlation of 0.958.
Build and Assess scores had a Pearson correlation of 0.954 across 817 UK franchise networks.
Build and Launch scores had a Pearson correlation of 0.924 across 817 UK franchise networks.
More findings from the report
- 0.867Build and Grow scores had a Pearson correlation of 0.867 across 817 UK franchise networks.
- 6.2%Only 51 of 817 networks (6.2%) scored below 12/20 for Build.
Every finding is from Twine Growth’s analysis of the UK Franchise Growth Index. The base for each figure is stated in the finding itself.
What Build means
Within the Five Fibre Framework™, Build asks whether a successful business has been turned into something somebody else can operate consistently. The Index methodology considers the visible evidence around operational playbooks, onboarding and training, brand consistency, central systems and resources, and the extent to which a new franchisee appears able to launch without constant founder involvement.
The Franchise Build Chain
The chain is deliberately operational. A franchise can have a compelling brand and a strong recruitment proposition while still needing the infrastructure that allows another owner to deliver the model consistently.
What this report measures
This edition analyses the Build Scores, Build assessment reasons and structured fields already contained in the UK Franchise Growth Index. It does not claim to have inspected confidential manuals, portals, training programmes or internal technology. Where internal Build infrastructure is not publicly verifiable, the underlying Index assessment is deliberately conservative.
Supplementary website by website Build coding, including exact training duration, portal type, onboarding stages and quality control mechanisms, is not present as structured fields in the master Index. Those measures are therefore not invented or estimated here. They remain a clear next research layer for a future expanded edition.
The UK franchise Build landscape
| Build band | Networks | Share of Index |
|---|---|---|
| Scale Ready (16–20) | 577 | 70.6% |
| Strong (12–15.5) | 189 | 23.1% |
| Developing (10–11.5) | 51 | 6.2% |
The distribution is concentrated towards the upper end of the 20 point Build scale. 577 networks score 16 or above, while 189 sit between 12 and 15.5. The remaining 51 score below 12.
This should not be read as a league table of franchise quality. The score reflects the strength of evidence available to the Index against the Build criteria, not profitability, franchisee satisfaction or the quality of confidential operating systems.
What the public evidence shows
The Build reason field is not a line by line audit of every internal system. It is, however, useful for understanding what the underlying research repeatedly looked for and where public evidence was commonly qualified.
| Phrase found in Build assessment reason | Networks | Share |
|---|---|---|
| Structured Training | 124 | 15.2% |
| Operational Support | 136 | 16.6% |
| Repeatable Systems | 48 | 5.9% |
| Brand Standards | 503 | 61.6% |
| Central Systems | 151 | 18.5% |
| Founder | 511 | 62.5% |
These counts are textual evidence counts, not prevalence estimates for the underlying capability. A network may have structured training even where the exact phrase “structured training” does not appear in its assessment reason. They are included to make the evidence base transparent rather than to overstate what the dataset can prove.
The recurring limitation
Across the Index, Build assessments repeatedly withhold full confidence where internal playbooks, central systems, onboarding depth or founder independence cannot be verified publicly. That matters because Build is precisely the fibre where some of the most important evidence is likely to sit behind the public website.
Build and the other fibres
| Relationship | Pearson correlation |
|---|---|
| Build vs Assess | 0.954 |
| Build vs Launch | 0.924 |
| Build vs Grow | 0.867 |
| Build vs Amplify | 0.958 |
| Build vs Overall Five Fibre Score | 0.976 |
All relationships are positive and strong in this dataset. The strongest individual fibre relationship is Build with Amplify. That is directionally logical within the framework: local customer growth is easier to systemise when the franchise already has repeatable infrastructure, but this analysis shows association only. It does not establish causation.
The Build to Grow gap
Using a threshold set before analysis, a network is classed as “Infrastructure Ahead” where its Build Score exceeds its Grow Score by at least three points. 785 of 817 networks meet that definition.
No network in the master Index has a Grow Score higher than its Build Score. This is a feature of the current Index data, not a claim that every UK franchise network has better operations than recruitment in practice.
Why this matters
The pattern suggests a market where the public evidence behind the operating model is generally stronger than the public evidence behind consistent franchisee recruitment. For franchisors, that creates a useful strategic question: if the system is already built, is the network equally capable of taking that opportunity to market and converting the right people?
Industry profiles
| Industry | Networks | Average Build | Median Build |
|---|---|---|---|
| Food and Drink | 163 | 16.10 | 16 |
| Childcare and Children’s Activities | 115 | 17.01 | 18 |
| Business Consultancy, Services and Support | 69 | 15.99 | 16 |
| Cleaning Services | 66 | 16.86 | 17.5 |
| Retail | 42 | 17.37 | 18 |
| Care | 36 | 16.76 | 17 |
| Education and Tuition | 36 | 16.53 | 17.25 |
| Fitness | 32 | 16.83 | 18 |
| Estate and Letting Agents | 31 | 17.10 | 18 |
| Home Improvement and Renovations | 30 | 16.12 | 16 |
| Maintenance, Building, Plumbing and Gardening | 29 | 16.69 | 16.5 |
| Automotive | 28 | 16.21 | 16 |
Only industries with at least 20 networks are shown. The spread is meaningful but not extreme. This supports a more useful interpretation than a winner and loser league table: different sectors appear to reach repeatability through different operating models, training requirements, technology and brand controls.
Operating model profiles
| Operating model flag | Networks | Average Build | Median Build |
|---|---|---|---|
| Home based | 436 | 16.25 | 16 |
| Mobile | 313 | 16.37 | 16.5 |
| Retail premises | 350 | 16.84 | 18 |
| Management | 553 | 16.62 | 17 |
| Executive | 567 | 16.58 | 17 |
These groups overlap. A franchise can be both management led and premises based, for example, so the rows should not be added together. The comparison is designed to show how Build evidence varies with operating structure, not to imply that one model is inherently stronger.
The founder question
A founder can carry years of operating knowledge instinctively. A franchise cannot scale that instinct by itself. Build is the point at which knowledge needs to become documentation, training, tools, support and standards that can travel across a network.
The Index does not contain a structured founder dependency field, so this report does not label individual networks as founder dependent. That would go beyond the evidence. Instead, founder independence remains part of the Build assessment logic and a priority for future supplementary research.
What should be measured next
The next version of the Build research can turn the internal infrastructure question into a dedicated national dataset. The most valuable addition would be a consistent website by website coding layer, backed by source URLs and human validation.
| Research layer | Examples of evidence to code |
|---|---|
| Documentation | Operations manual, SOP library, playbook, checklists, documented workflows |
| Training | Initial training, duration, location, practical training, online learning, certification |
| Ongoing learning | Refresher training, coaching, workshops, continuous development |
| Central systems | Portal, intranet, LMS, CRM, reporting platform, knowledge base |
| Support | Named support roles, field support, operational support, mentoring, reviews |
| Brand consistency | Guidelines, templates, signage, uniforms, approved suppliers, service standards |
| Measurement | KPIs, audits, benchmarking, compliance reviews, customer feedback |
| Franchisee voice | Councils, advisory boards, surveys, working groups, peer forums |
| Founder independence | Dedicated teams and systems beyond direct founder involvement |
Until that coding exists, this report does not convert generic public phrases such as “full support” into specific claims about the depth or quality of a network’s operating infrastructure.
Ten findings from the Index
- 01The master Index contains Build Scores for all 817 networks analysed.
- 02The average Build Score is 16.53/20 and the median is 16.5/20.
- 03577 networks (70.6%) score at least 16/20.
- 0451 networks (6.2%) score below 12/20.
- 05Build correlates most strongly with Amplify among the other individual fibres at 0.958.
- 06Build and Assess have a correlation of 0.954.
- 07Build and Launch have a correlation of 0.924.
- 08Build and Grow have a correlation of 0.867.
- 09785 networks (96.1%) have a Build Score at least three points above Grow.
- 10Across industries represented by at least 20 networks, average Build Scores span 15.99 to 17.37 out of 20.
Methodology
Methodology and research integrity
- Population: 817 franchise networks contained in the master UK Franchise Growth Index.
- Primary metric: the existing Five Fibre Build Score, measured on a 20 point scale.
- Research basis: publicly available information captured in the master Index and its Build assessment reasons.
- Cross fibre analysis: Pearson correlations calculated across networks with numeric scores for both fibres. All five fibre score fields were complete in the dataset.
- Build to Grow Gap: defined before analysis as Build Score minus Grow Score. “Infrastructure Ahead” means a gap of at least three points.
- Industry analysis: only industries with at least 20 networks are shown in the main comparison.
- Operating model analysis: flags overlap and are not mutually exclusive.
- Text evidence counts: exact phrase occurrence within Build assessment reasons. These counts describe assessment wording and are not treated as direct prevalence measures.
- Missing or unverifiable internal information is not converted to zero and is not estimated.
- No causal claims are made from correlations.
Research integrity
The report distinguishes public evidence from internal capability. An operations manual, training programme, portal or quality control system may exist without being publicly described. Conversely, a public claim that support or systems exist does not independently verify their depth or effectiveness.
This report uses the shared Index methodology, set out in full in how the UK Franchise Growth Index was created, plus the report-specific method above.
Research limitations
The master Index does not contain structured fields for training duration, onboarding stages, portal type, technology stack, franchise councils, quality controls or the detailed contents of operations manuals. Those research layers require a separate supplementary audit. This report therefore uses only measures the dataset can substantiate and does not manufacture the missing observations.
For journalists
- Report
- UK Franchise Build Report
- Publisher
- Twine Growth
- Publication date
- 30 September 2026
- Research source
- The UK Franchise Growth Index
- Research population
- 817 networks
- Sample for this report
- 817 networks (every network in the Index)
- Data snapshot
- 22 September 2026
- Methodology
- Methodology for this report and the Index methodology
- Permanent link
- https://www.twinegrowth.com/uk-franchise-growth-index/reports/uk-franchise-build-report/
- Media enquiries
- Contact Twine Growth
Source: Twine Growth, the UK Franchise Growth Index
The statistic to remember
In 785 of 817 networks, the Build Score is at least three points higher than the Grow Score. Within this Index, the infrastructure evidence is therefore materially ahead of the recruitment evidence for more than nine out of ten networks.
That is not a judgement that those networks recruit badly. It is a measurable difference between two fibres in the same framework, calculated across the same national dataset.
Source line
Source: Twine Growth, the UK Franchise Growth Index. Research cut off 22 September 2026. Published September 2026.
Corrections and updates
- Published
- 30 September 2026
- Last updated
- 1 October 2026
- Version
- 1.0 (PDF version 1.0)
- Data snapshot
- 22 September 2026
No corrections have been issued for this edition.
If you represent a franchise network and something in this report is wrong or out of date, send us the evidence and we will review it. Corrections are recorded here, and the page address never changes.