Executive summary
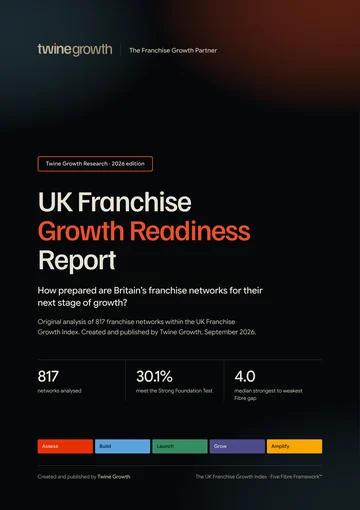
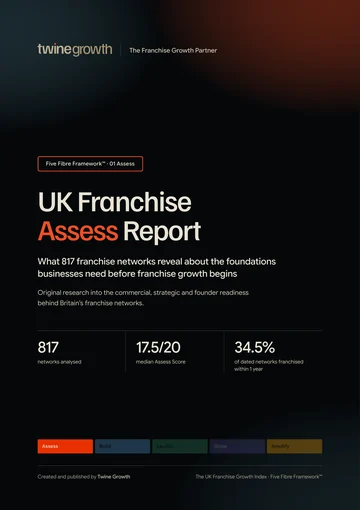
Twine Growth analysed 817 franchise networks in the UK Franchise Growth Index. All 817 networks had a complete set of Five Fibre scores and were included in the core readiness analysis. The framework examines publicly identifiable evidence across Assess, Build, Launch, Grow and Amplify. It does not measure profitability, franchisee satisfaction, investment quality or future success.
What the data says first
- Assess and Build share the strongest average public evidence at 16.5 out of 20, while Grow is lowest at 12.3.
- 76 of 817 networks, 9.3%, have more than six points between their strongest and weakest Fibre.
- 40 networks, 4.9%, meet the report definition of the Missing Fibre Effect: four Fibres at 14 or above with at least one Fibre at 10 or below.
- 55 networks, 6.7%, show a two speed pattern where the average of Assess, Build and Launch differs from Grow and Amplify by at least four points.
- 0 networks, 0.0%, have Amplify at least four points above the average of their other four Fibres.
- 0 networks, 0.0%, show the reverse pattern: the first four Fibres average at least 14 while Amplify is 10 or below.
Key findings
Analysis by Twine Growth found that 76 of 817 UK franchise networks analysed, 9.3%, had more than six points between their strongest and weakest Five Fibre scores.
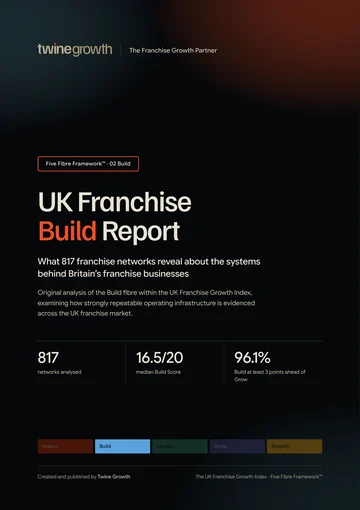
Across 817 complete records, Assess and Build shared the highest average score at 16.5 out of 20, compared with 12.3 for Grow.
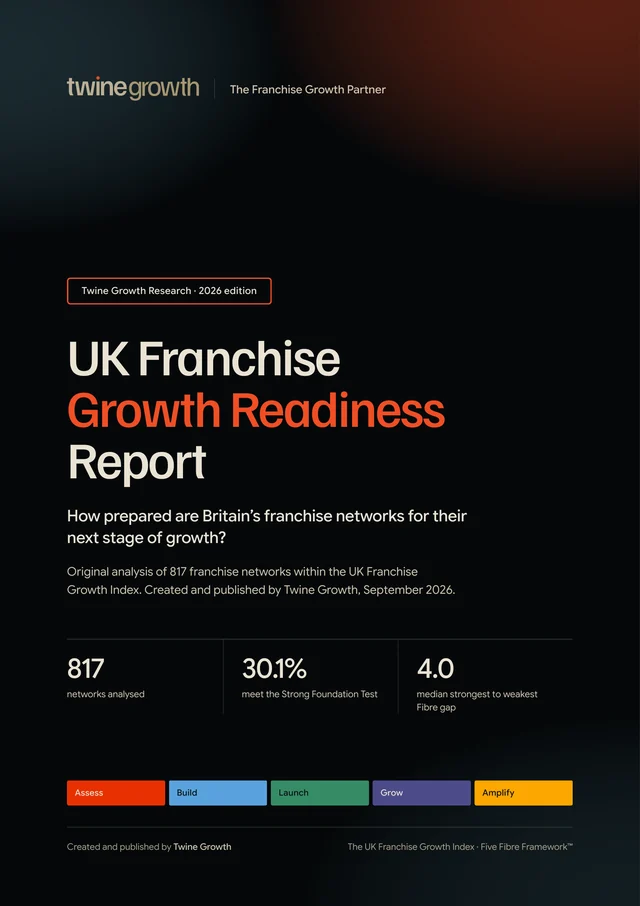
246 of 817 networks, 30.1%, meet the Strong Foundation Test.
67 of 817 networks, 8.2%, have at least one Fibre four points or more below their own Five Fibre average.
40 of 817 networks, 4.9%, meet the Missing Fibre Effect definition.
55 of 817 networks, 6.7%, show a two speed profile.
More findings from the report
- 0.0%0 of 817 networks, 0.0%, had an Amplify score at least four points above the average of their other four Fibres.
- 0.0%0 of 817 networks, 0.0%, averaged at least 14 across Assess, Build, Launch and Grow while scoring 10 or below for Amplify.
- 14.0/20Among 83 networks that began franchising from 2021 onwards, the average Five Fibre score was 14.0 out of 20 and the median balance gap was 4.5 points.
- 16.5/20Among 132 networks that began franchising in 2006 or earlier, the average Five Fibre score was 16.5 out of 20 and the median balance gap was 3.0 points.
- 15.1/20802 networks were classified as actively recruiting from the master Index recruitment field. Their average Five Fibre score was 15.1 out of 20.
- 13.5/2055 networks had a parsed public location count of 25 or fewer. Their average Five Fibre score was 13.5 out of 20.
Every finding is from Twine Growth’s analysis of the UK Franchise Growth Index. The base for each figure is stated in the finding itself.
Understanding Growth Readiness
What Franchise Growth Readiness means
Franchise Growth Readiness is the extent to which a franchise network displays the publicly identifiable foundations required to Assess, Build, Launch, Grow and Amplify its franchise proposition.
It is deliberately different from network size, age, reputation or commercial success. A large established network can have uneven public evidence. A smaller emerging network can display balanced foundations. The report therefore focuses on the shape and balance of the growth system, not a league table of franchises.
The Five Fibres
Public evidence around the opportunity, market, positioning and proposition.
Public evidence that the proposition has the infrastructure needed to support a functioning network.
Public evidence that the franchise can take its proposition to market effectively.
Public evidence of systems and activity capable of supporting continued network growth.
Public evidence of visibility, authority, reputation and momentum capable of strengthening future growth.
The national readiness profile
Across 817 complete Five Fibre records, the national profile is not even. Assess and Build share the highest average score. Grow records the lowest. The difference matters because an overall score can conceal where a network is comparatively strong and where its public growth foundations appear thinner.
| Fibre | Average | Median |
|---|---|---|
| Assess | 16.5 | 17.5 |
| Build | 16.5 | 16.5 |
| Launch | 15.5 | 16.0 |
| Grow | 12.3 | 13.0 |
| Amplify | 14.6 | 15.0 |
Balance and growth gaps
Five Fibre Balance
Five Fibre Balance measures the difference between a network’s strongest and weakest Fibre. A smaller gap means the public evidence is more evenly developed. A larger gap means the network presents a more uneven readiness profile.
| Balance band | Networks | Share |
|---|---|---|
| Within 2 points | 21 | 2.6% |
| Within 4 points | 434 | 53.1% |
| Within 6 points | 286 | 35.0% |
| More than 6 points | 76 | 9.3% |
The median network has a 4.0 point gap between its strongest and weakest Fibre. 455 of 817 networks, 55.7%, sit within four points across all five Fibres.
The Growth Readiness Gap
For each network, Twine Growth identified the Fibre furthest behind its own strongest public foundation. This is an internal comparison. It does not assume that every network should look identical.
| Most common weakest Fibre | Networks | Share |
|---|---|---|
| Assess | 0 | 0.0% |
| Build | 0 | 0.0% |
| Launch | 0 | 0.0% |
| Grow | 816 | 99.9% |
| Amplify | 1 | 0.1% |
Grow is the most frequent weakest Fibre, appearing as the lowest score for 816 of 817 networks. Ties are resolved by the first minimum in the Five Fibre sequence, so this measure should be read as directional rather than as a unique diagnosis in every case.
The Missing Fibre Effect
For this report, the Missing Fibre Effect means a network has at least four Fibres scoring 14 or above while at least one Fibre scores 10 or below. The threshold is intentionally transparent and can be repeated in future editions.
This pattern matters because a strong overall total can mask one materially weaker part of the public growth system. It is not evidence that the capability is absent internally. It means the public evidence captured by the Index is uneven.
Readiness by maturity and size
Growth readiness and franchise maturity
Franchise age is treated as a comparison variable, not a quality signal. The chart below is cross sectional. It compares networks of different ages at one point in time and does not prove that an individual network follows the same path as it matures.
| Franchise cohort | Networks | Median balance gap | Mean Fibre score |
|---|---|---|---|
| Before 1990 | 33 | 3.0 | 16.6 |
| 1990 to 1999 | 60 | 3.0 | 16.2 |
| 2000 to 2009 | 64 | 4.0 | 16.7 |
| 2010 to 2014 | 50 | 4.0 | 16.1 |
| 2015 to 2019 | 48 | 4.0 | 15.4 |
| 2020 onwards | 97 | 4.5 | 14.1 |
The first five years
83 networks in the Index began franchising from 2021 onwards. Their average Five Fibre score is 14.0 out of 20, compared with 16.1 for networks that started earlier. Their median balance gap is 4.5 points.
Established networks
132 networks began franchising in 2006 or earlier. Their median Five Fibre balance gap is 3.0 points. This shows why longevity should be analysed separately from balance rather than treated as a proxy for readiness.
Growth readiness and network size
| Approx locations | Networks | Mean Fibre score | Median balance gap |
|---|---|---|---|
| 1 to 5 | 27 | 13.0 | 5.0 |
| 6 to 10 | 9 | 14.7 | 5.0 |
| 11 to 25 | 19 | 13.8 | 4.0 |
| 26 to 50 | 29 | 15.6 | 4.0 |
| 51 to 100 | 40 | 16.1 | 3.0 |
| 101 plus | 47 | 16.9 | 3.0 |
Among the 55 networks with a parsed public location count of 25 or fewer, the average Five Fibre score is 13.5 and the median balance gap is 4.5. This group contains both newer concepts and long established smaller networks, so size alone should not be treated as a growth stage.
Recruitment and industry patterns
Recruitment readiness
Recruitment activity is compared with the public growth foundations captured by the Index. This is not an assessment of whether a network should or should not recruit. It asks whether the public evidence differs according to recruitment status.
| Recruitment status | Networks | Mean Fibre score | Median balance gap |
|---|---|---|---|
| Actively recruiting | 802 | 15.1 | 4.0 |
| Limited or selective | 8 | 14.4 | 4.0 |
| Recruitment unclear | 7 | 12.7 | 6.0 |
Growth readiness by industry
Industry analysis is shown for the ten largest industry groups in the Index. It is presented as a pattern comparison, not an industry ranking.
| Industry | Networks | Mean score | Median gap |
|---|---|---|---|
| Food and Drink | 163 | 14.8 | 4.0 |
| Childcare and Children’s Activities | 115 | 15.6 | 4.0 |
| Business Consultancy, Services and Support | 69 | 14.4 | 4.5 |
| Cleaning Services | 66 | 15.3 | 4.0 |
| Retail | 42 | 15.8 | 4.0 |
| Care | 36 | 15.4 | 4.0 |
| Education and Tuition | 36 | 15.1 | 4.0 |
| Fitness | 32 | 15.5 | 4.0 |
| Estate and Letting Agents | 31 | 15.8 | 4.0 |
| Home Improvement and Renovations | 30 | 14.8 | 4.0 |
Investment and operating models
Investment and growth readiness
Minimum franchise investment is the capital required from a prospective franchisee. It is not a measure of how much the franchisor has invested in its own growth infrastructure. The comparison below therefore tests association only.
| Minimum investment | Networks | Mean Fibre score | Median gap |
|---|---|---|---|
| Under £10,000 | 89 | 15.2 | 4.0 |
| £10,000 to £24,999 | 102 | 15.4 | 4.0 |
| £25,000 to £49,999 | 75 | 15.4 | 4.0 |
| £50,000 to £99,999 | 35 | 14.7 | 4.0 |
| £100,000 to £249,999 | 40 | 15.6 | 4.0 |
| £250,000 plus | 18 | 17.0 | 3.0 |
Operating model patterns
| Operating model | Networks | Mean Fibre score | Median gap |
|---|---|---|---|
| Home based | 436 | 14.8 | 4.0 |
| Mobile | 313 | 14.9 | 4.0 |
| Retail premises | 350 | 15.4 | 4.0 |
| Management franchise | 553 | 15.2 | 4.0 |
| Executive franchise | 567 | 15.1 | 4.0 |
Operating model fields can overlap. A network can, for example, be both home based and mobile. These figures should therefore be read as independent slices of the Index rather than mutually exclusive market shares.
Visibility and information transparency
Visibility versus readiness
Amplify captures public visibility, authority, reputation and momentum. The analysis tests whether visibility runs ahead of the other four Fibres, and whether the opposite pattern also exists.
For the Amplification Paradox test, Amplify must be at least four points above the average of Assess, Build, Launch and Grow. For infrastructure without visibility, the first four Fibres must average at least 14 while Amplify scores 10 or below. These are research thresholds, not judgements about individual franchise quality.
The Growth Readiness Matrix
The matrix groups networks by years since franchising began and by Five Fibre balance gap, dividing each at its median for the eligible records with a usable franchise start year. This creates four descriptive populations without declaring one quadrant better than another.
| Established + balanced Older networks with a smaller balance gap. | Established + uneven Older networks with a larger balance gap. |
|---|---|
| Newer + balanced Younger networks with a smaller balance gap. | Newer + uneven Younger networks with a larger balance gap. |
The median franchise age among records with a usable start year is 16 years. The median Five Fibre balance gap is 4.0 points.
Public transparency and the information gap
Twine Growth created a simple Public Information Completeness measure using seven fields already present in the master Index: minimum investment, franchising start year, approximate locations, recruitment status, headquarters town or city, headquarters county or region, and headquarters country. A field counts only when a usable public record is present.
| Public fields available | Networks | Share |
|---|---|---|
| 7 of 7 | 177 | 21.7% |
| 6 of 7 | 211 | 25.8% |
| 5 of 7 | 201 | 24.6% |
| 4 of 7 | 81 | 9.9% |
| 3 of 7 | 47 | 5.8% |
| 2 of 7 | 96 | 11.8% |
| 1 of 7 | 4 | 0.5% |
The median network has 5 of the seven selected public information fields available. This measure is about disclosure and discoverability. It is not a measure of franchise quality.
Strong foundations and key findings
The Strong Foundation Test
For reproducibility, this report defines a Strong Foundation profile as all five Fibre scores at 14 or above, with no more than four points between the strongest and weakest Fibre. The threshold identifies consistency in publicly identifiable evidence. It does not identify the best franchises.
The Growth Constraint Test identifies a network where at least one Fibre sits four or more points below that network’s own Five Fibre average. It is therefore an internal consistency test rather than a comparison against another franchise.
What surprised us
- 01The average gap between Assess and Build, the joint strongest national Fibres, and Grow, the weakest, is 4.2 points.
- 029.3% of networks have more than six points between their strongest and weakest Fibre.
- 03Only 30.1% meet the report’s deliberately demanding Strong Foundation consistency test.
- 046.7% display a two speed profile between the first three Fibres and the final two.
- 05Visibility runs materially ahead of the other four Fibres for 0.0% of networks, while 0.0% show the opposite infrastructure without visibility pattern.
Ten things we learned
- 817 of 817 networks have a complete Five Fibre score set in this master Index.
- Assess and Build share the highest average Fibre score at 16.5 out of 20.
- Grow has the lowest average Fibre score at 12.3 out of 20.
- The median strongest to weakest Fibre gap is 4.0 points.
- 455 of 817 networks, 55.7%, keep all five Fibres within four points.
- 40 of 817 networks, 4.9%, meet the Missing Fibre Effect definition.
- 55 of 817 networks, 6.7%, show a two speed profile.
- 0 of 817 networks, 0.0%, meet the Amplification Paradox threshold.
- 246 of 817 networks, 30.1%, meet the Strong Foundation Test.
- 67 of 817 networks, 8.2%, have at least one Fibre four points or more below their own Five Fibre average.
What makes this report different
The UK Franchise Growth Readiness Report owns one specific question: whether the publicly identifiable foundations needed for future growth appear connected across Assess, Build, Launch, Grow and Amplify.
It does not repeat the role of the State of UK Franchising Report, the UK Franchise Growth Index Report, the UK Franchise Growth Gap Report, the UK Franchise Investment Report, 50 UK Franchise Networks to Watch, the UK Franchise Recruitment Report, the UK Franchise Industry Intelligence Report or the UK Franchise Hotspots Report.
The UK Franchise Growth Index gives Twine Growth a network by network view across 817 franchise networks. The Five Fibre Framework™ then shows where those public foundations appear connected, where they appear uneven and how readiness patterns differ across the UK franchise landscape.
Methodology
Methodology and research integrity
- Research population: 817 franchise networks in the master UK Franchise Networks Index.
- Eligible Five Fibre population: 817 networks with all five Fibre scores present.
- Data cut off: the master Index dated 22 September 2026.
- Five Fibre sequence: Assess, Build, Launch, Grow, Amplify. Each Fibre is scored out of 20 and the overall score is the sum out of 100.
- Five Fibre Balance: maximum Fibre score minus minimum Fibre score for each network.
- Missing Fibre Effect: at least four Fibres score 14 or above and at least one Fibre scores 10 or below.
- Two speed profile: the average of Assess, Build and Launch differs from the average of Grow and Amplify by at least four points.
- Amplification Paradox: Amplify is at least four points above the average of Assess, Build, Launch and Grow.
- Infrastructure without visibility: Assess, Build, Launch and Grow average at least 14 while Amplify scores 10 or below.
- Strong Foundation Test: every Fibre scores at least 14 and the strongest to weakest gap is no greater than four points.
- Growth Constraint Test: at least one Fibre is four or more points below that network’s own Five Fibre average.
- Franchise age: 2026 minus the first four digit year identified in the Franchising Started field.
- Network size: the first numeric value identified in Approx Locations. Because public sources use different definitions, this is approximate.
- Minimum investment: the Investment From field, grouped into fixed bands.
- Recruitment: Active, Recruiting and Recruiting UK Area Developers are grouped as actively recruiting. Selective, Limited and Resales only are grouped separately. Publicly undisclosed records remain unclear.
- Public Information Completeness: count of seven selected fields with a usable public record. Missing or explicitly unavailable records do not score. Minimum investment counts only when the Investment From field holds a plain number, and each of the other six fields counts when it holds anything other than a blank or an entry such as “Not publicly disclosed”, “Not publicly stated”, “No Public Record Available” or “Not applicable”.
- Industry comparisons: descriptive only. The main industry chart shows the ten largest industry groups.
- Rounding: percentages and mean scores are normally shown to one decimal place.
- No missing score or commercial value is converted to zero.
Research integrity
The Index measures publicly identifiable evidence. A lower score or missing record does not necessarily mean the infrastructure does not exist. It means sufficient evidence was not identified publicly during the assessment.
The report does not measure profitability, franchisee satisfaction, operational compliance, investment quality, business valuation or future success. Correlation does not demonstrate causation. The analysis is descriptive and should not be treated as financial or investment advice.
This report uses the shared Index methodology, set out in full in how the UK Franchise Growth Index was created, plus the report-specific method above.
For journalists
- Report
- UK Franchise Growth Readiness Report
- Publisher
- Twine Growth
- Publication date
- 30 September 2026
- Research source
- The UK Franchise Growth Index
- Research population
- 817 networks
- Sample for this report
- 817 networks (every network in the Index)
- Data snapshot
- 22 September 2026
- Methodology
- Methodology for this report and the Index methodology
- Permanent link
- https://www.twinegrowth.com/uk-franchise-growth-index/reports/uk-franchise-growth-readiness-report/
- Media enquiries
- Contact Twine Growth
Source: Twine Growth, the UK Franchise Growth Index
Preferred media attribution
Source line for charts and extracts
Source: Twine Growth, the UK Franchise Growth Index
Corrections and updates
- Published
- 30 September 2026
- Last updated
- 1 October 2026
- Version
- 1.0 (PDF version 1.0)
- Data snapshot
- 22 September 2026
No corrections have been issued for this edition.
If you represent a franchise network and something in this report is wrong or out of date, send us the evidence and we will review it. Corrections are recorded here, and the page address never changes.