Executive summary
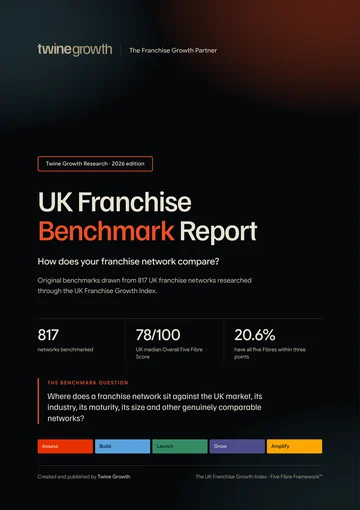
The UK Franchise Benchmark Report establishes a comparative baseline for the public growth-readiness evidence captured across the UK Franchise Growth Index. It does not rank franchise brands. It shows where the market sits, where the quartiles begin, and how those benchmarks change across comparable cohorts.
The national median is strongest in Assess at 17.5/20 and weakest in Grow at 13/20. Build sits at 16.5, Launch at 16 and Amplify at 15. The result is a market benchmark that is visibly stronger at strategic foundation and infrastructure than at evidenced network growth.
The benchmark also changes materially by context. Among the 336 networks with an exact usable franchising start year, the median Overall Five Fibre Score rises from 68 among networks franchising for 0 to 3 years to 84 among those franchising for 21 years or more. Among the 171 networks with a usable location count, the median rises from 65 for networks with 1 to 5 locations to 84 for networks with 101 or more.
Investment is less linear. Across the 359 networks with an identifiable numeric minimum investment, median Overall Five Fibre Scores range from 78 in several lower and mid investment bands to 83.5 in the £100,000+ cohort. Higher investment should not be interpreted as a better franchise.
Industry context matters too. Among industries with at least 20 networks, median Overall Five Fibre Scores range from 73 in Food and Drink and Business Consultancy, Services and Support to 83 in Estate and Letting Agents. These are cohort benchmarks, not industry quality rankings.
Key findings
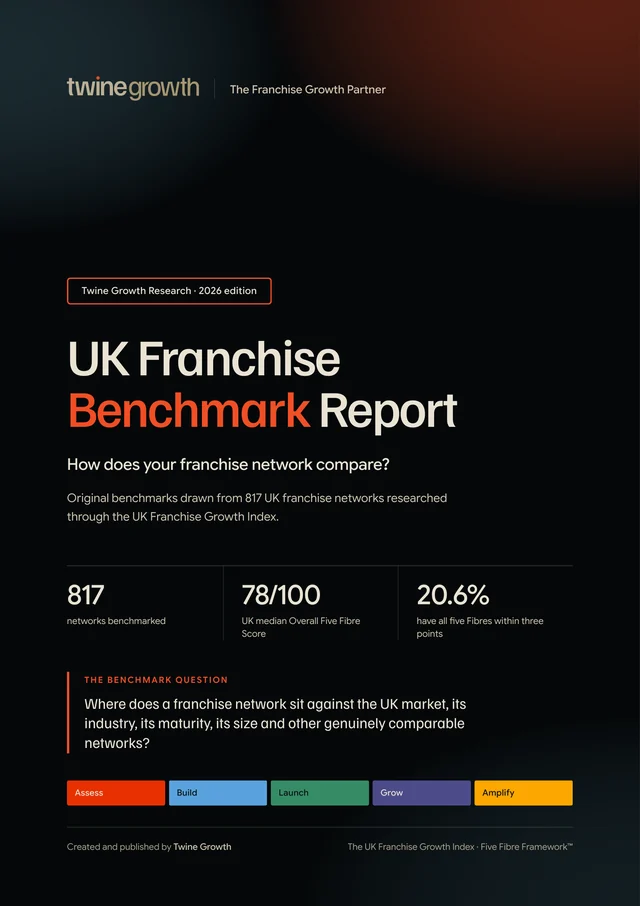
Across 817 UK franchise networks, the median Overall Five Fibre Score is 78/100; the upper quartile begins at 84 and the top 10% threshold is 92.
Only 168 of 817 networks (20.6%) have all five Fibre scores within three points of each other.
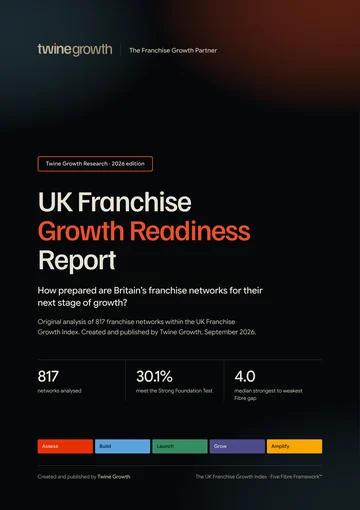
The median strongest-to-weakest Five Fibre gap is four points.
Assess is the strongest national median at 17.5/20; Grow is the weakest at 13/20.
Among 336 networks with an exact usable franchising start year, the median overall score rises from 68 for 0-3 year networks to 84 for 21+ year networks.
Among 171 networks with a usable location count, the median overall score rises from 65 for 1-5 locations to 84 for 101+ locations.
More findings from the report
- 10 pointsAmong industries with at least 20 networks, median overall scores span 10 points, from 73 to 83.
- 359Among 359 networks with a numeric minimum investment, the benchmark is not linear across investment bands.
- 83.5International brands record a median overall score of 83.5 versus 74 for UK-origin networks; the comparison is descriptive and does not isolate origin from age, scale or model.
- 9 of 12The median public-information completeness benchmark is 9 of 12 fields; 114 networks have all 12 core fields identifiable.
- 3.25The upper-quartile score group has a median balance gap of 3.25 points versus 5 points in the lower quartile.
- 9 of 12The upper-quartile score group has a median public-information completeness of 9 of 12 versus 7 of 12 in the lower quartile.
Every finding is from Twine Growth’s analysis of the UK Franchise Growth Index. The base for each figure is stated in the finding itself.
What is the UK Franchise Benchmark?
A useful benchmark begins with the question: compared with what? A ten-location home-based franchise is not automatically comparable with a 300-location premises-based international brand. This report therefore starts with a national baseline and then narrows the comparison.
The report uses medians as the primary benchmark because several franchise variables are skewed by very large networks and very high investment models. Quartiles show the middle 50% of the market, while the 90th percentile identifies the threshold reached by the top 10% of scores.
Benchmark bands
- Lower quartile: at or below the 25th percentile for the measure.
- Lower middle: above the 25th percentile up to the median.
- Upper middle: above the median but below the 75th percentile.
- Upper quartile: at or above the 75th percentile.
- Top 10% benchmark: at or above the 90th percentile.
These bands describe position against the evidence measured by the UK Franchise Growth Index. They do not establish profitability, franchisee satisfaction, investment returns or overall franchise quality.
The national benchmark
Across all 817 networks, the national benchmark provides the broadest reference point. The median Overall Five Fibre Score is 78/100. The lower quartile threshold is 66 and the upper quartile begins at 84.
| Measure | 25th | Median | 75th | 90th | n |
|---|---|---|---|---|---|
| Assess | 15 | 17.5 | 18 | 20 | 817 |
| Build | 15 | 16.5 | 18 | 20 | 817 |
| Launch | 14 | 16 | 17 | 18 | 817 |
| Grow | 10 | 13 | 15 | 16 | 817 |
| Amplify | 12 | 15 | 16 | 18 | 817 |
| Overall | 66 | 78 | 84 | 92 | 817 |
Five Fibre benchmarks
Each Fibre has its own distribution and therefore its own benchmark. The report treats Assess, Build, Launch, Grow and Amplify as connected but distinct measures.
Assess benchmark
The strategic-foundation benchmark. Median 17.5/20; upper quartile begins at 18; top 10% begins at 20.
Build benchmark
The franchise-infrastructure benchmark. Median 16.5/20; upper quartile begins at 18; top 10% begins at 20.
Launch benchmark
The route-to-market benchmark. Median 16/20; upper quartile begins at 17; top 10% begins at 18.
Grow benchmark
The network-growth benchmark. Median 13/20; upper quartile begins at 15; top 10% begins at 16.
Amplify benchmark
The local-growth benchmark. Median 15/20; upper quartile begins at 16; top 10% begins at 18.
Five Fibre balance benchmark
The report introduces a new Five Fibre Balance Measure: the number of points between a network's strongest and weakest Fibre score. A smaller gap means the five evidenced dimensions sit closer together. It does not mean the scores are necessarily high.
Grow is the weakest-scoring Fibre for 816 of the 817 networks when ties are allowed. That concentration explains why the balance measure is usually a measure of how far Grow sits behind a stronger Assess or Build position. Because Grow weakness has been explored elsewhere in the Twine Growth research programme, this report uses it primarily to establish the new balance benchmark.
Industry benchmarks
Industry is one of the most useful comparison layers because networks serving very different markets often operate with different models, investment levels and routes to scale. Primary industry benchmarks are shown only where at least 20 networks are available.
| Industry | n | Overall | Assess | Build | Launch | Grow | Amplify |
|---|---|---|---|---|---|---|---|
| Estate and Letting Agents | 31 | 83 | 18 | 18 | 17 | 13.5 | 16 |
| Retail | 42 | 82.25 | 17.75 | 18 | 16.75 | 14 | 16 |
| Childcare and Children’s Activities | 115 | 80 | 17.5 | 18 | 16 | 13 | 16 |
| Fitness | 32 | 80 | 17.5 | 18 | 16 | 12.75 | 16 |
| Cleaning Services | 66 | 78 | 17.25 | 17.5 | 16 | 13 | 16 |
| Care | 36 | 78 | 16.5 | 17 | 16 | 13 | 15.5 |
| Education and Tuition | 36 | 78 | 17.5 | 17.25 | 16 | 12.5 | 15 |
| Maintenance, Building, Plumbing and Gardening | 29 | 78 | 17 | 16.5 | 16 | 13 | 15 |
| Home Improvement and Renovations | 30 | 74 | 16.5 | 16 | 15 | 13 | 14 |
| Automotive | 28 | 74 | 17.25 | 16 | 15 | 12.25 | 14 |
| Food and Drink | 163 | 73 | 16 | 16 | 15 | 11 | 14 |
| Business Consultancy, Services and Support | 69 | 73 | 16 | 16 | 15 | 12 | 14 |
Category benchmarks
Category benchmarks narrow the comparison further. Only categories with at least 20 networks are shown as primary benchmarks in this edition.
| Franchise category | n | Overall median | Grow median | Balance gap |
|---|---|---|---|---|
| Store Franchise | 21 | 89 | 15.5 | 3.5 |
| Estate Agency Franchise | 20 | 89 | 15.5 | 3.5 |
| Early Years Franchise | 21 | 81.5 | 14 | 4 |
| Commercial Cleaning Franchise | 22 | 80.5 | 13.5 | 4 |
| Home Care Franchise | 33 | 78 | 13 | 4 |
| Children’s Creative Franchise | 31 | 78 | 13 | 4 |
| Children’s Sports Franchise | 38 | 78 | 13 | 4 |
| Specialist Cleaning Franchise | 27 | 78 | 12 | 4 |
| Consultancy Franchise | 26 | 74.25 | 12 | 4.5 |
| Quick Service Franchise | 72 | 73 | 12 | 4 |
| Dessert Franchise | 25 | 72 | 11 | 4 |
The range is wider at category level than at broad industry level. Store Franchise records a median Overall Five Fibre Score of 89 across 21 networks, as does Estate Agency Franchise across 20, while Dessert Franchise records 72 across 25. These figures are contextual benchmarks and should not be interpreted as a ranking of franchise quality or investment attractiveness.
Network maturity benchmarks
An exact usable franchising start year is available for 336 networks. This smaller evidence base is used for maturity analysis and is kept separate from the 817-network national benchmark.
| Maturity | n | Overall | A | B | L | G | Am | Gap |
|---|---|---|---|---|---|---|---|---|
| 0-3 years | 59 | 68 | 15 | 15 | 15 | 10 | 14 | 4 |
| 4-7 years | 48 | 74.5 | 16 | 16.25 | 16 | 12 | 14 | 4 |
| 8-12 years | 44 | 80 | 17.5 | 18 | 16 | 13 | 16 | 4 |
| 13-20 years | 65 | 83 | 18 | 18 | 17 | 14 | 16 | 3.5 |
| 21+ years | 120 | 84 | 18 | 18 | 17 | 15 | 16 | 3 |
Network size benchmarks
Usable location counts are available for 171 networks. The sample is therefore much smaller than the national population and should be read as a size benchmark for the networks where a credible location count could be identified.
| Locations | n | Overall median | Grow median | Balance gap |
|---|---|---|---|---|
| 1-5 | 27 | 65 | 9 | 5 |
| 6-25 | 28 | 70 | 11 | 4 |
| 26-50 | 29 | 80 | 13 | 4 |
| 51-100 | 40 | 83 | 14 | 3 |
| 101+ | 47 | 84 | 15 | 3 |
The 1 to 5 location cohort records a median overall score of 65 and a median Grow score of 9. Networks with 101+ identifiable locations record medians of 84 overall and 15 for Grow. The balance gap also narrows from 5 points to 3.
Investment benchmarks
A numeric minimum investment is identifiable for 359 networks. The investment benchmark uses practical bands with sufficient sample sizes rather than assuming that a higher investment level represents a stronger franchise.
| Minimum investment | n | Overall median | Grow median | Balance gap |
|---|---|---|---|---|
| Under £10k | 89 | 78 | 13 | 4 |
| £10k-£24,999 | 102 | 78 | 13 | 4 |
| £25k-£49,999 | 75 | 80 | 13 | 4 |
| £50k-£99,999 | 35 | 78 | 13 | 4 |
| £100k+ | 58 | 83.5 | 15 | 4 |
The pattern is not linear. Under £10,000 and £10,000 to £24,999 both record a median overall score of 78. The £25,000 to £49,999 cohort records 80, £50,000 to £99,999 returns to 78, and £100,000+ records 83.5.
Operating model benchmarks
| Operating characteristic | n | Overall median | Grow median | Balance gap |
|---|---|---|---|---|
| Management Franchise | 553 | 78 | 13 | 4 |
| Home Based | 436 | 75.5 | 12.5 | 4 |
| Mobile | 313 | 78 | 12.5 | 4 |
| Retail Premises | 350 | 80 | 13 | 4 |
| Executive Franchise | 567 | 78 | 13 | 4 |
| Master Franchise Available | 211 | 81 | 14 | 4 |
The strongest median in this operating-model view appears among networks where a Master Franchise option is publicly identified, at 81/100 across 211 networks. Retail Premises networks record 80 across 350. Home Based networks record 75.5 across 436.
These groups overlap. A network can be management-led, executive and home-based at the same time. They should therefore be read as characteristics, not mutually exclusive market segments.
UK origin vs international
| Cohort | n | Overall | Assess | Build | Launch | Grow | Amplify | Gap |
|---|---|---|---|---|---|---|---|---|
| UK origin | 659 | 74 | 17 | 16 | 16 | 12.5 | 14 | 4 |
| International brand | 232 | 83.5 | 18 | 18 | 17 | 14.5 | 16 | 4 |
International brands in the dataset record a higher median Overall Five Fibre Score, 83.5 compared with 74 for UK-origin networks. Their median Fibre profile is also higher across all five Fibres. The balance gap is identical at 4 points.
Recruitment and public information benchmarks
Recruitment status is publicly identifiable for 810 of the 817 networks. The dataset is heavily concentrated in publicly active recruitment states, so recruitment status is less useful as a balanced comparative cohort than maturity, size or industry.
A separate Franchise Information Completeness Benchmark measures whether 12 core public data points could be identified: website, opportunity URL, description, investment from, investment to, franchisees, locations, Franchise Director, CEO/Founder, LinkedIn company page, Franchise Director LinkedIn and recruitment status.
This is a benchmark of public information availability, not a judgement of business quality. Missing information may exist internally or through non-public channels.
The benchmark UK franchise network
A composite benchmark profile brings together the median values available across the Index. Because different fields have different usable sample sizes, this is not a description of one real franchise network.
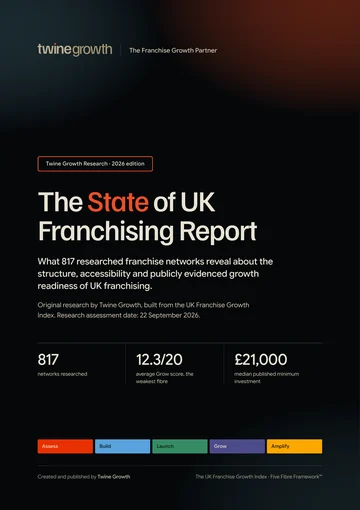
Among the separate subsets where those variables are usable, the median minimum investment is £21,000 (n=359), the median identifiable location count is 60 (n=171), and the median maturity is 15 years since franchising began (n=336).
The upper quartile profile
The upper quartile begins at an Overall Five Fibre Score of 84. There are 220 networks at or above that threshold because ties at the quartile boundary are retained.
| Measure | Lower quartile | Middle 50% | Upper quartile |
|---|---|---|---|
| Overall Five Fibre | 61 | 78 | 90 |
| Balance gap | 5 | 4 | 3.25 |
| Public info completeness | 7/12 | 9/12 | 9/12 |
| Median locations* | 10 | 40 | 122.5 |
| Median maturity* | 4 yrs | 13 yrs | 23.5 yrs |
| Median minimum investment* | £24,000 | £18,370 | £30,000 |
*Calculated only from records where that variable is usable; denominators therefore differ from the score-group totals.
Benchmark gaps and what changes least
Benchmarking is most useful when it identifies both meaningful differences and areas where the data does not move in a simple way.
Largest observed benchmark differences
- Network maturity: a 16-point difference in median Overall Five Fibre Score between 0-3 year and 21+ year cohorts within the n=336 usable maturity sample.
- Network size: a 19-point difference between 1-5 locations and 101+ locations within the n=171 usable location sample.
- Industry: a 10-point spread between the highest and lowest median among industries with at least 20 networks.
- Origin: international brands record an 83.5 median overall score versus 74 for UK-origin networks.
- Balance: lower-quartile networks carry a 5-point median Fibre gap compared with 3.25 points in the upper quartile.
What changes less cleanly
- Investment does not produce a linear score progression across the five practical investment bands.
- Five Fibre balance remains at a 4-point median across most industry and investment cohorts.
- Several operating-model characteristics overlap heavily, limiting any claim that one model independently explains a stronger benchmark.
The benchmark matrix
| Cohort | n | Overall | Assess | Build | Launch | Grow | Amplify | Gap |
|---|---|---|---|---|---|---|---|---|
| UK market | 817 | 78 | 17.5 | 16.5 | 16 | 13 | 15 | 4 |
| 0-3 yrs | 59 | 68 | 15 | 15 | 15 | 10 | 14 | 4 |
| 21+ yrs | 120 | 84 | 18 | 18 | 17 | 15 | 16 | 3 |
| 1-5 locations | 27 | 65 | 13.5 | 14.5 | 15 | 9 | 12 | 5 |
| 101+ locations | 47 | 84 | 18 | 18 | 17 | 15 | 16 | 3 |
| Under £10k | 89 | 78 | 17.5 | 17 | 16 | 13 | 15 | 4 |
| £100k+ | 58 | 83.5 | 18 | 18 | 17 | 15 | 16 | 4 |
| Estate & Letting | 31 | 83 | 18 | 18 | 17 | 13.5 | 16 | 4 |
| Food & Drink | 163 | 73 | 16 | 16 | 15 | 11 | 14 | 4 |
| International | 232 | 83.5 | 18 | 18 | 17 | 14.5 | 16 | 4 |
| UK origin | 659 | 74 | 17 | 16 | 16 | 12.5 | 14 | 4 |
The matrix is deliberately selective. It brings the main comparison layers into one view while keeping denominators visible. A reader should always use the closest credible comparator rather than treating every row as equally relevant.
Which benchmark should you use?
Start broad, then narrow the comparison only when the underlying sample remains credible.
The closer the comparator becomes, the more contextually useful it can be. But narrower comparisons also reduce sample size. This report therefore favours transparency over false precision.
Methodology
This report uses the master UK Franchise Networks Index as at 23 September 2026. The dataset contains 817 franchise networks and 51 fields, including Five Fibre scores, industry and category classifications, investment, network scale, maturity, operating-model indicators, recruitment status and public-information fields.
Benchmark calculations
- Medians are the primary benchmark for skewed franchise variables.
- Quartiles use the 25th, 50th and 75th percentiles of the eligible records for each measure.
- The top 10% threshold uses the 90th percentile.
- The Five Fibre Balance Measure is the difference between a network's highest and lowest Fibre score.
- Overall and individual Fibre score benchmarks use all 817 networks because those fields are complete.
- Industry and category primary benchmarks require at least 20 networks. Cohorts of 10-19 may be discussed only with an explicit small-sample warning; cohorts below 10 are not standalone benchmarks.
- Maturity is calculated from an exact usable franchising start year to 2026. This produces 336 usable records.
- Network size uses a numeric location count that can be reliably extracted from the public record. This produces 171 usable records.
- Minimum-investment analysis uses numeric Investment From values. This produces 359 usable records.
- Public Information Completeness uses 12 defined fields and counts a field as missing, not zero, only when it is blank or reads 'No Public Record Available', 'Not publicly disclosed' or 'Not publicly stated'.
- Ties at quartile thresholds are retained, so group counts can differ slightly from exactly 25% of the population.
Rounding
Scores and medians are shown to the level needed to preserve the underlying result. Percentages are generally shown to one decimal place. Currency is rounded to the nearest pound where a median is reported.
Correlation and causation
The report describes associations between observed cohorts. It does not claim that maturity, size, investment, origin or operating model causes a higher Five Fibre score.
This report uses the shared Index methodology, set out in full in how the UK Franchise Growth Index was created, plus the report-specific method above.
Research limitations
Research limitations and corrections
The Index is built from publicly identifiable evidence. Different franchise networks disclose different levels of information, and some records are more complete than others.
- Missing information does not equal zero.
- Approximate franchisee and location figures are used only where a usable numeric value can be identified.
- Investment structures differ and cannot always be reduced to one comparable number.
- International brands may have UK operations that differ materially from their global network.
- Small cohorts can be unstable, which is why minimum sample thresholds are enforced.
- Five Fibre scores reflect the methodology of the UK Franchise Growth Index and do not measure internal profitability, franchisee earnings, franchisee satisfaction, legal compliance or investment returns.
- Public information can change after the dataset cut-off date.
For journalists
- Report
- UK Franchise Benchmark Report
- Publisher
- Twine Growth
- Publication date
- 30 September 2026
- Research source
- The UK Franchise Growth Index
- Research population
- 817 networks
- Sample for this report
- 817 networks (every network in the Index)
- Data snapshot
- 23 September 2026
- Methodology
- Methodology for this report and the Index methodology
- Permanent link
- https://www.twinegrowth.com/uk-franchise-growth-index/reports/uk-franchise-benchmark-report/
- Media enquiries
- Contact Twine Growth
Source: Twine Growth, the UK Franchise Growth Index
Corrections and updates
- Published
- 30 September 2026
- Last updated
- 1 October 2026
- Version
- 1.0 (PDF version 1.0)
- Data snapshot
- 23 September 2026
No corrections have been issued for this edition.
If you represent a franchise network and something in this report is wrong or out of date, send us the evidence and we will review it. Corrections are recorded here, and the page address never changes.