Executive summary
UK franchising is usually described through surveys, directory listings, individual brand claims and broad market estimates. The UK Franchise Growth Index creates a different research base: 817 individual franchise networks assembled into one structured dataset and assessed consistently.
This report asks one question: what can we now see about UK franchising that could not be seen before the Index existed?
What makes the research different
- The unit of analysis is the individual franchise network, not a respondent to a survey.
- The dataset combines industry, category, operating model, investment, recruitment, public information and Five Fibre growth readiness fields.
- Missing public evidence is recorded as missing evidence. It is not treated as proof that a capability does not exist.
- The Five Fibre scores measure publicly evidenced growth foundations, not profitability, franchisee satisfaction or investment quality.
Originality check
A publication search completed before this report was prepared found existing UK franchise material on market size, investment costs and individual sectors. It did not identify a public report using this 817 network dataset or benchmarking UK franchise networks through Twine Growth’s Five Fibre Framework™. Because investment medians and low cost franchise themes already appear elsewhere, this report does not present those themes as first ever findings. The distinctive research contribution is the combined network level dataset, the Five Fibre benchmark and the transparency analysis.
Key findings
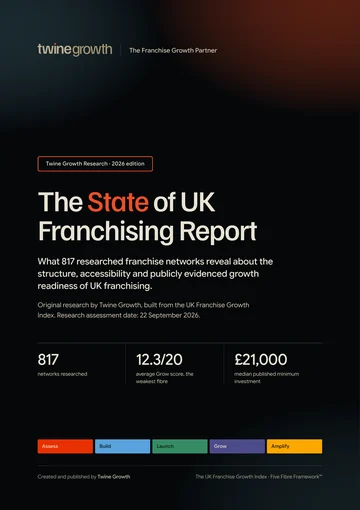
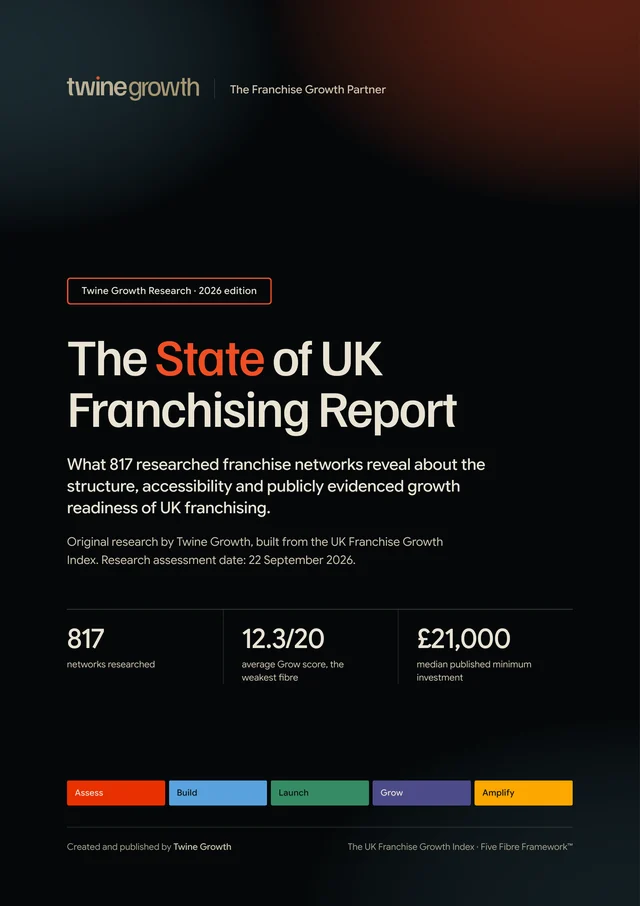
Across all 817 networks in the UK Franchise Growth Index, Grow is the weakest Five Fibre measure, averaging 12.3 out of 20 compared with 16.5 for Assess and 16.5 for Build.
250 of 817 networks, 30.6%, score 10 or below for Grow, while 114, 14.0%, score 16 or above.
802 of 817 networks, 98.2%, are recorded as actively recruiting or recruiting franchise opportunities.
Among 359 networks with a numeric minimum investment, the median published minimum is £21,000; 191 of those networks, 53.2%, are below £25,000.
436 of 817 networks, 53.4%, are classified as home based, while 350, 42.8%, are classified as retail premises. Categories can overlap.
Among 195 home based networks with numeric minimum investment data, the median is £12,500. Among 152 retail premises networks with numeric data, the median is £50,000.
More findings from the report
- 56.1%458 of 817 networks, 56.1%, do not have a usable public record for when franchising started under the Index methodology.
- 52.9%432 of 817 networks, 52.9%, do not have a usable public approximate franchisee count under the Index methodology.
- 32.7%Only 267 of 817 networks, 32.7%, carry a High research confidence rating; 456, 55.8%, are Medium, reflecting uneven public disclosure rather than franchise quality.
Every finding is from Twine Growth’s analysis of the UK Franchise Growth Index. The base for each figure is stated in the finding itself.
The growth gap sits after the franchise has been built
The clearest finding in the Index is not that UK franchise networks lack foundations. It is that the publicly evidenced strength of those foundations falls sharply when the task moves from building the franchise to generating repeatable commercial growth.
| Finding | What the Index shows |
|---|---|
| 817 networks | The Index provides a network level research base rather than a small survey sample. |
| 802 networks | 98.2% of the Index is recorded as actively recruiting or recruiting franchise opportunities. |
| £21,000 | Median published minimum investment among the 359 networks with a numeric minimum investment. |
| 436 networks | 53.4% are classified as home based, showing how far franchising extends beyond premises led formats. |
| 78/100 | Median Overall Five Fibre Score across all 817 networks. |
| 458 networks | 56.1% do not provide a usable public record for when franchising started. |
| 267 networks | 32.7% carry a High research confidence rating. Most records are Medium confidence because public disclosure varies. |
UK franchising is broader than the household names suggest
The Index spans 817 networks across a wide range of industries and categories. Food and Drink is the largest single industry in the dataset, but it accounts for only 20.0% of all networks. The remainder is spread across children’s activities, business services, cleaning, care, education, fitness, retail, property, automotive and many specialist categories.
The ten largest industries still account for only part of the picture
- Food and Drink: 163 networks, 20.0% of the Index.
- Childcare and Children’s Activities: 115 networks, 14.1% of the Index.
- Business Consultancy, Services and Support: 69 networks, 8.4% of the Index.
- Cleaning Services: 66 networks, 8.1% of the Index.
- Retail: 42 networks, 5.1% of the Index.
- Care: 36 networks, 4.4% of the Index.
- Education and Tuition: 36 networks, 4.4% of the Index.
- Fitness: 32 networks, 3.9% of the Index.
- Estate and Letting Agents: 31 networks, 3.8% of the Index.
- Home Improvement and Renovations: 30 networks, 3.7% of the Index.
This distribution matters because UK franchising is not one market. Recruitment economics, capital requirements and local customer acquisition differ materially between a quick service restaurant, a children’s activity franchise and a home based business service.
The premises stereotype misses much of the market
The operating model fields show that modern UK franchise opportunities frequently combine management, executive, home based and mobile characteristics. These classifications can overlap, so they should not be added together as market shares.
| Home based | 436 networks (53.4%) are classified Yes. |
| Mobile | 313 networks (38.3%) are classified Yes. |
| Retail premises | 350 networks (42.8%) are classified Yes. |
| Management | 553 networks (67.7%) are classified Yes. |
| Executive | 567 networks (69.4%) are classified Yes. |
What this changes
Franchise ownership in the Index is not dominated by one physical format. More networks are classified as executive franchises than retail premises franchises, and more than half are home based. That changes the practical meaning of entry cost, territory design, local marketing and owner recruitment.
The typical published entry point is far below the headline cost of premises led franchising
A numeric minimum investment is available for 359 of the 817 networks. Within that disclosed subset, the median minimum investment is £21,000. This is a minimum entry figure, not a total project cost, and should not be interpreted as the amount required to launch every franchise.
Operating model changes the capital picture
| Home based | Median minimum investment £12,500 across 195 networks with numeric data. |
| Mobile | Median minimum investment £12,500 across 144 networks with numeric data. |
| Retail premises | Median minimum investment £50,000 across 152 networks with numeric data. |
| Management | Median minimum investment £35,000 across 229 networks with numeric data. |
| Executive | Median minimum investment £35,000 across 238 networks with numeric data. |
The strongest contrast is between home based and retail premises models. Among networks with numeric investment data, the home based median is £12,500 while the retail premises median is £50,000. This is an association within the Index, not evidence that the operating model alone causes the difference.
The first benchmark across all five growth foundations
Twine Growth assesses each network through the Five Fibre Framework™. The framework is designed to examine whether the foundations needed for sustainable franchise growth are visible in public evidence.
Readiness, positioning and market fit, measured before anything is built.
The systems, brand and operations a franchisee can actually follow.
Testing, onboarding and support that make early success repeatable.
Commercial growth, lead quality and conversion, scaled the right way.
Local marketing and support so every franchisee grows, not just the network.
Grow is the clear weak point in the public evidence
Assess and Build both average 16.5 out of 20 when rounded to one decimal place. Launch averages 15.5. Amplify averages 14.6. Grow falls to 12.3. The gap between the strongest and weakest average fibre is 4.2 points out of 20.
Why this is commercially important
The pattern suggests that public evidence is generally stronger around having a franchise proposition, systems and onboarding than around the measurable machinery needed to generate and convert a sustained pipeline of suitable franchise prospects. This does not prove that individual networks lack those systems internally. It shows that the evidence is weaker or less visible at market level.
Network growth and franchisee growth are different jobs
Amplify performs better than Grow, but remains below Assess, Build and Launch. That distinction matters. Recruiting more franchisees expands the network. Helping existing franchisees generate local customers strengthens the economics of the units already inside it. Sustainable scale needs both.
The average hides a wide spread of public evidence
The Overall Five Fibre Score averages 75.5 out of 100 and the median is 78. The distribution is more informative than either number alone.
- Below 60: 106 networks (13.0%).
- 60 to 69: 162 networks (19.8%).
- 70 to 79: 183 networks (22.4%).
- 80 to 89: 218 networks (26.7%).
- 90 to 100: 148 networks (18.1%).
These bands are descriptive, not awards, rankings or investment recommendations. They show how much publicly evidenced growth infrastructure was found under the Index methodology.
Industry changes the benchmark, but Grow remains the recurring constraint
To avoid fragile comparisons, the table below includes industries represented by at least 25 networks. It shows average scores, not a league table. Different sectors have different economics and public disclosure habits.
| Industry | Base | Assess | Build | Launch | Grow | Amplify |
|---|---|---|---|---|---|---|
| Food and Drink | 163 | 16.1 | 16.1 | 15.3 | 12.0 | 14.2 |
| Childcare and Children’s Activities | 115 | 16.9 | 17.0 | 15.8 | 13.0 | 15.2 |
| Business Consultancy, Services and Support | 69 | 16.1 | 16.0 | 14.7 | 11.4 | 13.8 |
| Cleaning Services | 66 | 16.7 | 16.9 | 15.5 | 12.6 | 14.7 |
| Retail | 42 | 17.3 | 17.4 | 16.1 | 13.0 | 15.4 |
| Care | 36 | 16.7 | 16.8 | 15.7 | 13.1 | 14.9 |
| Education and Tuition | 36 | 16.4 | 16.5 | 15.6 | 12.3 | 14.5 |
| Fitness | 32 | 16.7 | 16.8 | 15.8 | 12.9 | 15.0 |
| Estate and Letting Agents | 31 | 17.1 | 17.1 | 16.1 | 13.3 | 15.1 |
| Home Improvement and Renovations | 30 | 16.4 | 16.1 | 15.2 | 12.1 | 14.2 |
| Maintenance, Building, Plumbing and Gardening | 29 | 16.7 | 16.7 | 15.6 | 12.6 | 14.6 |
| Automotive | 28 | 16.3 | 16.2 | 15.1 | 12.0 | 14.4 |
Source: the UK Franchise Growth Index, Twine Growth. Base varies by industry and is shown in the table. Assessment date: 22 September 2026.
Across every industry in this comparison, Grow is the lowest average fibre. The recurring pattern is more important than small differences between sectors: the commercial growth layer is the least strongly evidenced part of the system.
Public records make franchise age much harder to measure than brand age
An exact franchising start year can be extracted for only 255 networks. For 458 networks, 56.1% of the full Index, a usable public record for the franchising start date is unavailable under the research rules.
| Started franchising from 2024 onwards | 32 of 255 networks with an exact year (12.5%). |
| Started from 2022 onwards | 53 of 255 (20.8%). |
| Started from 2017 onwards | 93 of 255 (36.5%). |
Why the missing dates are a finding
The inability to establish franchise age consistently is not merely a research inconvenience. It shows how uneven public franchise disclosure remains. A prospective franchisee, journalist or researcher often cannot establish from public information when a network actually began franchising, even when the underlying brand history is visible.
Almost the entire Index is competing for new owners
This does not mean every network is recruiting in every territory at the same intensity. It does show the scale of simultaneous demand for suitable franchise owners across the researched market.
Recruitment is a market, not an internal process
A franchise proposition competes not only with brands in its own category. It competes with hundreds of other ownership opportunities for the same person’s capital, confidence, time and appetite for risk. That makes positioning, lead quality and conversion central growth disciplines rather than administrative recruitment tasks.
The Grow finding becomes more significant in this context
Against a market where 98.2% of networks are recorded as recruiting, Grow is still the weakest average fibre at 12.3 out of 20. The Index therefore shows a high competition environment alongside the weakest public evidence in the fibre responsible for commercial growth, lead quality and conversion.
The market is visible, but many of its most useful facts are not
The Index records missing public information rather than filling gaps with assumptions. That makes disclosure itself measurable.
| Franchising start date | 458 networks (56.1%) lack a usable public record. |
| Approximate franchisee count | 432 networks (52.9%) lack a usable public record. |
| Minimum investment | 355 networks (43.5%) lack a usable public record. |
| Franchise Director | 459 networks (56.2%) lack a usable public record. |
| Franchise Director LinkedIn | 656 networks (80.3%) lack a usable public record. |
A missing field is not a negative judgement about the network. It means the research could not establish that information publicly to the standard required by the Index.
Most records are usable, but public evidence is uneven
| High | 267 networks (32.7%). |
| Medium | 456 networks (55.8%). |
| Low | 94 networks (11.5%). |
Confidence measures the completeness and clarity of the public evidence used to build a record. It is not a score for franchise quality. A strong franchise can have a Low confidence record if key information is difficult to verify publicly.
What journalists should take from this
Use the denominator supplied with each statistic. Where a finding relies on a subset, the subset is stated. The report does not convert missing data into a market wide claim.
Five findings that challenge the easy picture of franchising
| Finding | What the Index shows |
|---|---|
| Growth infrastructure is the weak link | Grow averages 12.3/20, materially below every other fibre. |
| Franchising is often not premises led | 436 networks are home based and 567 are executive, while 350 are retail premises. |
| Entry cost has two very different worlds | The disclosed home based median is £12,500; the retail premises median is £50,000. |
| Recruitment competition is nearly universal | 98.2% of networks are recorded as recruiting in some form. |
| Basic chronology is often unavailable | 56.1% lack a usable public franchising start date. |
None of these findings says that one format is better than another. They show why a single stereotype of the UK franchise market is inadequate.
What the dataset supports, and what it does not
| Finding | What the Index shows |
|---|---|
| “Franchising mainly means shops and restaurants.” | The Index contains 350 retail premises networks, but 436 home based, 313 mobile and 567 executive classifications. Models overlap. |
| “A typical franchise costs six figures.” | Among 359 networks with numeric minimum investment, the median minimum is £21,000. This is not the same as total launch cost. |
| “Once the franchise system is built, growth follows.” | Build averages 16.5/20 while Grow averages 12.3/20. The public evidence does not support treating those as the same capability. |
| “Public franchise information is standardised.” | Missing rates vary sharply by field, from common operating model classifications to 80.3% missing usable Franchise Director LinkedIn URLs. |
More investment does not strongly predict a stronger Five Fibre score
Across the 359 networks where both a numeric minimum investment and an Overall Five Fibre Score are available, the Spearman correlation is 0.11. That is a weak positive relationship, not a strong one.
In practical terms, a higher published entry price is not a reliable proxy for stronger publicly evidenced growth foundations in this dataset. Price and growth readiness are different questions.
Industry investment medians
| Childcare and Children’s Activities | £8,998 median minimum investment across 54 networks with numeric data. |
| Education and Tuition | £9,995 median minimum investment across 19 networks with numeric data. |
| Cleaning Services | £14,968 median minimum investment across 32 networks with numeric data. |
| Business Consultancy, Services and Support | £18,500 median minimum investment across 23 networks with numeric data. |
| Home Improvement and Renovations | £19,995 median minimum investment across 19 networks with numeric data. |
| Maintenance, Building, Plumbing and Gardening | £19,995 median minimum investment across 13 networks with numeric data. |
| Automotive | £20,000 median minimum investment across 12 networks with numeric data. |
| Estate and Letting Agents | £21,250 median minimum investment across 12 networks with numeric data. |
| Care | £35,000 median minimum investment across 23 networks with numeric data. |
| Retail | £50,000 median minimum investment across 15 networks with numeric data. |
| Fitness | £85,500 median minimum investment across 12 networks with numeric data. |
| Food and Drink | £100,000 median minimum investment across 66 networks with numeric data. |
Source: the UK Franchise Growth Index, Twine Growth. Industry investment table includes only industries with at least 10 numeric minimum investment records. Assessment date: 22 September 2026.
What future editions can track
- Changes in the number and composition of networks in the Index.
- Movement in Five Fibre benchmarks and the Grow gap.
- Changes in published investment and operating models.
- Whether public franchise transparency improves over time.
- How newer networks develop as they move from launch into sustained growth.
The value of a recurring report is not simply another annual statistic. It is the ability to see what changed, where it changed and whether the foundations of franchise growth are becoming stronger.
Methodology
How the UK Franchise Growth Index was built and analysed
- Networks were identified through franchise directories, franchise websites and wider public research, then checked against the master Index to reduce duplicate naming and brand variations.
- Each network was researched individually using public information available at the time of assessment.
- Structured fields cover the franchise description, Five Fibre scores and reasoning, industry, category, location, brand history, recruitment, investment, operating model, leadership, public profiles, verification and research confidence.
- The assessment date for the Five Fibre records in this master dataset is 22 September 2026.
- Five Fibre scoring uses five measures worth 20 points each, creating an Overall Five Fibre Score out of 100.
- The scoring lens is public evidence. A low or missing public signal is not proof that an internal capability is absent.
- Where information could not be established publicly, the dataset uses explicit unavailable wording rather than an inferred value.
- For this report, numeric calculations use only values that can be parsed as numeric. Every subset statistic states its denominator.
- Operating model fields can overlap. A network can be home based, mobile, management and executive at the same time.
- Industry comparisons are descriptive. They are not rankings of franchise quality or recommendations to invest.
Five Fibre definitions
Readiness, positioning and market fit.
Systems, brand and operations.
Testing, onboarding and support.
Commercial growth, lead quality and conversion.
Local marketing and franchisee growth support.
This report uses the shared Index methodology, set out in full in how the UK Franchise Growth Index was created, plus the report-specific method above.
Research limitations
What this research can and cannot establish
- The Index is extensive, but it is not presented as an official census of every franchise network operating in the UK.
- Public information changes. Recruitment status, investment, leadership, network size and franchise availability can move after the assessment date.
- The absence of public evidence does not prove the absence of an internal process, capability or result.
- Minimum investment is not total investment. Different franchisors define published investment figures differently.
- Approximate franchisee and location data are particularly inconsistent across public sources, so this report avoids market wide unit count extrapolations from those fields.
- Correlation is not causation. Relationship tests in this report describe association only.
- Five Fibre scores are not profitability forecasts, franchisee satisfaction scores, legal due diligence or investment advice.
For journalists
- Report
- The State of UK Franchising Report
- Publisher
- Twine Growth
- Publication date
- 30 September 2026
- Research source
- The UK Franchise Growth Index
- Research population
- 817 networks
- Sample for this report
- 817 networks (every network in the Index)
- Data snapshot
- 22 September 2026
- Methodology
- Methodology for this report and the Index methodology
- Permanent link
- https://www.twinegrowth.com/uk-franchise-growth-index/reports/the-state-of-uk-franchising-report/
- Media enquiries
- Contact Twine Growth
Source: Twine Growth, the UK Franchise Growth Index
Preferred attribution
“According to The State of UK Franchising Report, published by Twine Growth and based on data from the UK Franchise Growth Index…”
Linking
Publications citing the research should link to the permanent report page or the UK Franchise Growth Index on the Twine Growth website so readers can inspect the original source and methodology. Report page: twinegrowth.com/uk-franchise-growth-index/reports/the-state-of-uk-franchising-report/. Methodology: twinegrowth.com/uk-franchise-growth-index/methodology/.
Charts for publishers
Publication quality versions of the charts in this report are available from Twine Growth on request, so editors can use the original visual rather than a screenshot from the report.
Corrections and updates
- Published
- 30 September 2026
- Last updated
- 1 October 2026
- Version
- 1.0 (PDF version 1.0)
- Data snapshot
- 22 September 2026
No corrections have been issued for this edition.
If you represent a franchise network and something in this report is wrong or out of date, send us the evidence and we will review it. Corrections are recorded here, and the page address never changes.