Executive summary
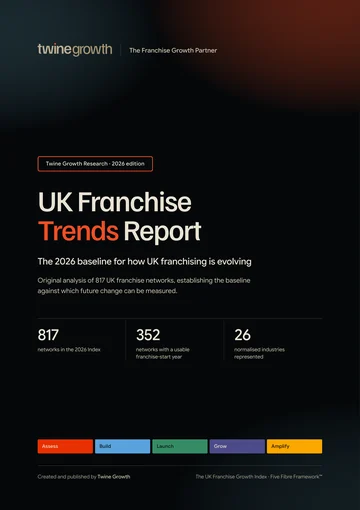
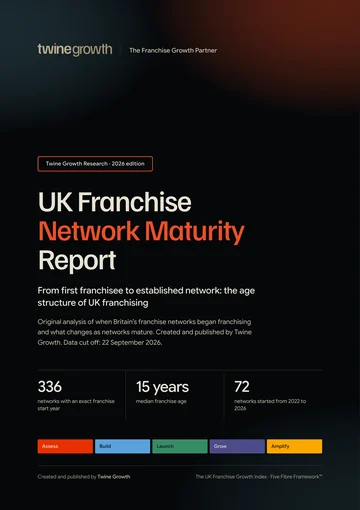
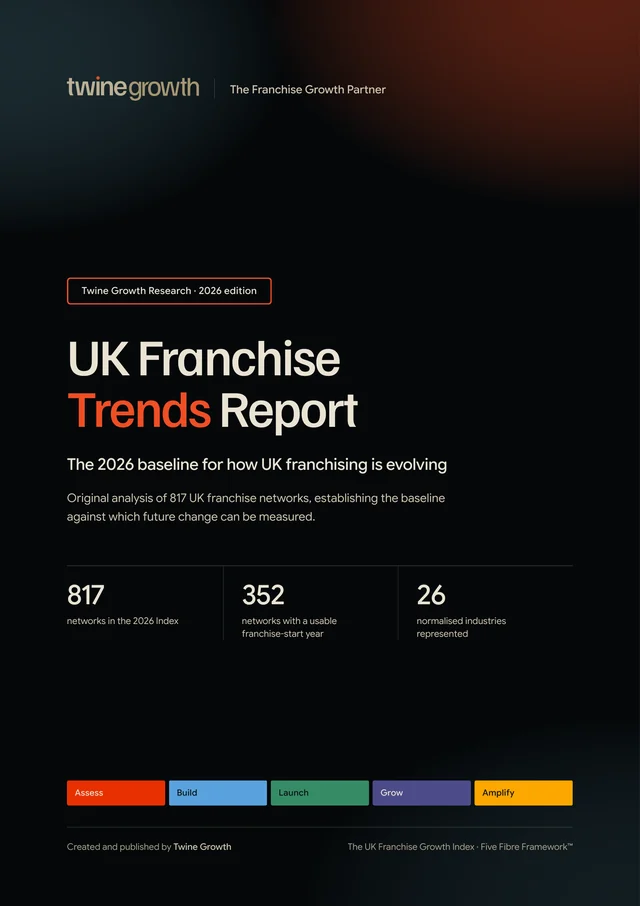
This first edition establishes the UK Franchise Trends Baseline 2026. It separates what can be measured now from generational patterns and from the indicators that can become genuine year-on-year trends once the same methodology is repeated.
Three evidence layers
| Layer | What it means |
|---|---|
| 1. Current market baseline | What the UK Franchise Growth Index can directly measure in 2026. |
| 2. Generational patterns | How networks with different recorded franchise-start periods differ today. |
| 3. Future tracking indicators | The measures Twine Growth will repeat annually to establish genuine longitudinal movement. |
Key findings
Among the 352 networks with a usable franchise-start year, the newest 2022–2026 cohort has a median Overall Five Fibre Score of 68, compared with 84 among networks that began franchising before 2000.
Grow shows the largest Five Fibre generational difference: a median 10.25/20 in the newest cohort versus 15/20 in the pre-2000 cohort.
UK-origin networks account for 93.1% of the newest cohort, compared with 63.4% of the pre-2000 cohort.
The newest cohort has a median public-information completeness score of 66.7%, compared with 91.7% in the pre-2000 cohort.
A specific franchise opportunity URL is recorded for 48.6% of the 2022–2026 cohort, the lowest share of the five cohorts.
Food and Drink accounts for 40.3% of the newest cohort after label normalisation, compared with 11.8% of the pre-2000 cohort.
More findings from the report
- 70.8%The five largest industries account for 70.8% of the newest cohort versus 55.9% of the pre-2000 cohort.
- 40.3%Home-based models are broadly similar between the two endpoint cohorts: 40.3% newest versus 45.2% pre-2000.
- £25,000Median minimum investment is £25,000 in the newest cohort and £30,000 in the pre-2000 cohort; the distributions do not support a simple claim of generational investment change.
- 4.5The median strongest-to-weakest Five Fibre gap is 4.5 points in the newest cohort versus 3 points in the pre-2000 cohort.
- 28.3%Among mapped UK headquarters, London represents 28.3% of the newest cohort versus 15.6% of the pre-2000 cohort.
- 817The 2026 Index contains 817 networks across 26 normalised industries and 97 franchise categories.
Every finding is from Twine Growth’s analysis of the UK Franchise Growth Index. The base for each figure is stated in the finding itself.
The 2026 baseline
The baseline is the fixed reference point for future editions. Where a field is not publicly identifiable, it remains missing rather than being converted to zero. That protects the integrity of future comparisons.
The Trends Framework
Recorded franchise-start dates and current characteristics
A frozen, reproducible snapshot of the Index
Repeat the same measures and distinguish market composition change from change within existing networks
What we can and cannot call a trend
The 2026 dataset is primarily cross-sectional. It tells us how networks of different generations look now. It does not reconstruct what those same networks looked like five, ten or twenty years ago.
- Differences between younger and older networks are generational patterns.
- Differences between industries are structural differences.
- Differences between investment bands are current market patterns.
- A genuine trend requires comparable observations at more than one point in time.
The generations of UK franchising
A usable franchise-start year is identifiable for 352 of the 817 networks. Five cohorts were chosen because each contains enough networks for principal comparison while preserving meaningful differences in network age.
| Franchise-start cohort | Networks | Median Overall | Median locations | Median minimum investment |
|---|---|---|---|---|
| 2022–2026 | 72 | 68 | 7.5 | £25,000 |
| 2017–2021 | 59 | 75 | 22.0 | £24,995 |
| 2010–2016 | 64 | 81 | 85.0 | £19,950 |
| 2000–2009 | 64 | 83 | 100.0 | £18,225 |
| Before 2000 | 93 | 84 | 115.0 | £30,000 |
The newest generation
The 72 networks that began franchising between 2022 and 2026 form the newest defensible cohort. Their current profile is distinctive in several ways, but the report does not treat those differences as proof of historic market change.
What stands out
- Food and Drink accounts for 40.3% of the newest cohort after normalising the Food & Drink label, making it far more concentrated than in the pre-2000 cohort.
- A specific franchise opportunity URL is recorded for 48.6% of the newest cohort, the lowest share of the five cohorts.
- Grow is the lowest median Fibre at 10.25/20, creating the largest Fibre difference against the pre-2000 cohort.
- The newest cohort is overwhelmingly UK-origin at 93.1%.
The established generation
The 93 networks that began franchising before 2000 provide the longest-established comparison cohort. Their larger current scale is expected in part because they have had substantially more time to build a network.
Industry and category patterns
The newest and longest-established cohorts are not composed of the same mix of sectors. This matters because an apparent generational difference can partly reflect industry composition.
| Industry | 2022–2026 share | Before 2000 share |
|---|---|---|
| Food and Drink | 40.3% | 11.8% |
| Business Consultancy, Services and Support | 9.7% | 9.7% |
| Childcare and Children’s Activities | 8.3% | 6.5% |
| Cleaning Services | 4.2% | 18.3% |
| Fitness | 2.8% | 0.0% |
| Health and Wellbeing | 6.9% | 1.1% |
| Home Improvement and Renovations | 5.6% | 4.3% |
The five largest industries account for 70.8% of the newest cohort, compared with 55.9% of the pre-2000 cohort. The newest cohort spans almost as many industries overall, but its largest sectors account for a greater share of the cohort.
Operating-model signals
Operating-model flags show more continuity than disruption. Home-based, management and executive characteristics are broadly similar between the newest and pre-2000 cohorts, while master-franchise availability is less common in the newest cohort.
Investment across generations
Minimum investment does not move in a simple straight line across the franchise generations. The newest cohort has a median identifiable minimum investment of £25,000, while the pre-2000 cohort sits at £30,000.
Network scale and scale-to-age
Current network size rises sharply across older franchise-start cohorts, but age itself gives established networks more time to accumulate locations. For that reason, current locations should not be interpreted as a direct measure of growth performance.
| Cohort | Median locations | Location records used |
|---|---|---|
| 2022–2026 | 7.5 | 30 |
| 2017–2021 | 22.0 | 17 |
| 2010–2016 | 85.0 | 13 |
| 2000–2009 | 100.0 | 29 |
| Before 2000 | 115.0 | 43 |
Exploratory Network Scale-to-Age Ratio
For networks with both a usable franchise-start year and identifiable location count, an exploratory ratio divides current locations by years since franchising began. It is not an annual growth rate because the opening dates of individual locations are unknown.
| Cohort | n | Median ratio | Q1 | Q3 |
|---|---|---|---|---|
| 2022–2026 | 30 | 4.38 | 1.50 | 17.50 |
| 2017–2021 | 17 | 3.33 | 1.00 | 10.00 |
| 2010–2016 | 13 | 6.36 | 3.33 | 7.69 |
| 2000–2009 | 29 | 4.47 | 2.78 | 12.50 |
| Before 2000 | 43 | 3.40 | 2.21 | 14.86 |
Because several cohorts have fewer than 20 usable scale-to-age records, this measure is exploratory in 2026 and should not be used as a standalone headline finding.
Five Fibre generational profile
The Five Fibre profile shows the shape of current evidence across Assess, Build, Launch, Grow and Amplify rather than reducing each cohort to one total score.
| Fibre | 2022–2026 | Before 2000 | Difference |
|---|---|---|---|
| Assess | 15 | 18 | 3 |
| Build | 15.75 | 18 | 2.25 |
| Launch | 15 | 17 | 2 |
| Grow | 10.25 | 15 | 4.75 |
| Amplify | 14 | 16 | 2 |
Five Fibre balance
The Five Fibre Balance Measure is the gap between a network’s strongest and weakest Fibre. A smaller gap indicates a more even evidence profile, not necessarily stronger commercial performance.
Recruitment and opportunity visibility
Recruitment status is highly active across the Index, so the more useful generational question is how clearly the franchise opportunity is surfaced publicly.
| Cohort | Specific opportunity URL | Active / recruiting status |
|---|---|---|
| 2022–2026 | 48.6% | 100.0% |
| 2017–2021 | 52.5% | 98.3% |
| 2010–2016 | 67.2% | 100.0% |
| 2000–2009 | 73.4% | 100.0% |
| Before 2000 | 66.7% | 94.6% |
The newest cohort records 48.6% specific opportunity-URL coverage, the lowest of the five cohorts, and the gap extends to other public-information fields.
The visibility generation gap
Public information completeness measures whether 12 consistently useful fields are publicly identifiable in the Index. It is a disclosure and visibility measure, not a business-quality score.
Where the gap appears
| Field | 2022–2026 visible | Before 2000 visible |
|---|---|---|
| CEO / Founder | 66.7% | 94.6% |
| Franchise Director | 48.6% | 88.2% |
| LinkedIn Company URL | 47.2% | 98.9% |
| LinkedIn Franchise Director URL | 15.3% | 51.6% |
UK origin and international signals
The origin mix is one of the clearest generational differences in the dataset. UK-origin networks make up 93.1% of the newest cohort compared with 63.4% of the pre-2000 cohort.
Geographic generational patterns
Headquarters geography is only analysed where a UK county or region can be mapped consistently. The chart therefore uses a smaller evidence base than the full 352-network franchise-start sample.
| Region | 2022–2026 | Before 2000 |
|---|---|---|
| London | 28.3% | 15.6% |
| Midlands | 18.9% | 20.3% |
| North West | 13.2% | 17.2% |
| Yorkshire | 13.2% | 3.1% |
| South East | 9.4% | 21.9% |
| South West | 5.7% | 6.3% |
| North East | 5.7% | 1.6% |
| East of England | 1.9% | 10.9% |
London accounts for 28.3% of mapped UK headquarters in the newest cohort versus 15.6% in the pre-2000 cohort. South East representation is stronger in the pre-2000 cohort, and the Midlands share is similar in both. Scotland and Wales do not have sufficient cohort counts for standalone trend claims here.
The 2026 franchise network
This is a composite baseline profile built from medians and modal characteristics. It is not an “average franchise” and does not imply that any one network matches every characteristic.
Newest-generation profile
| Measure | 2026 market baseline | 2022–2026 cohort |
|---|---|---|
| Overall Five Fibre | 78 | 68 |
| Minimum investment | £20,000 | £25,000 |
| Locations | 60 | 7.5 |
| Five Fibre gap | 4 | 4.5 |
| Public information completeness | 66.7% | 66.7% |
| Specific opportunity URL | 57.0% | 48.6% |
| UK origin | All-network mix | 93.1% |
What differs most - and what stays stable
Strongest generational differences
| Signal | 2022–2026 | Before 2000 | Difference |
|---|---|---|---|
| UK-origin share | 93.1% | 63.4% | 29.6 pts |
| Public information completeness | 66.7% | 91.7% | 25 pts |
| Overall Five Fibre median | 68 | 84 | 16 pts |
| Grow median | 10.25 | 15 | 4.75 pts |
| Five Fibre balance gap | 4.5 | 3.0 | 1.5 pts |
What appears surprisingly stable
- Home-based status: 40.3% newest versus 45.2% pre-2000.
- Executive-franchise status: 73.6% newest versus 71.0% pre-2000.
- Management-franchise status: 76.4% newest versus 67.7% pre-2000; the difference is not statistically persuasive in this comparison.
- Median minimum investment: £25,000 newest versus £30,000 pre-2000; the distributions do not support a simple generational investment story.
10 signals we will be watching
| Signal | 2026 baseline purpose |
|---|---|
| Industry composition | Share of networks by normalised industry and category. |
| Minimum investment | Median, quartiles and distribution of identifiable minimum investment. |
| Operating-model mix | Home-based, mobile, retail, management, executive and master-franchise characteristics. |
| Network scale | Median identifiable locations and changes within stable network IDs. |
| Recruitment posture | Movement between active, selective, limited and other recorded states. |
| Opportunity visibility | Presence of a specific franchise opportunity URL. |
| Public information completeness | Repeatable 12-field visibility measure. |
| Five Fibre profile | Overall and individual Fibre medians using the same scoring methodology. |
| Five Fibre balance | Gap between strongest and weakest Fibre. |
| Origin and geography | UK/international composition and mapped UK headquarters distribution. |
UK Franchise Trends Tracker
The tracker is deliberately one-sided in 2026. Future columns remain unfilled until comparable annual snapshots exist.
| Indicator | 2026 baseline | 2027 | 2028 | Direction |
|---|---|---|---|---|
| Networks | 817 | Future edition | Future edition | – |
| Median minimum investment | £20,000 | Future edition | Future edition | – |
| Median locations | 60 | Future edition | Future edition | – |
| Median Overall Five Fibre | 78 | Future edition | Future edition | – |
| Median Five Fibre gap | 4 | Future edition | Future edition | – |
| Specific opportunity URL | 57.0% | Future edition | Future edition | – |
| Median public-info completeness | 66.7% | Future edition | Future edition | – |
Regional and industry findings
Regional angles
- London has a larger share of mapped headquarters in the newest cohort than in the pre-2000 cohort: 28.3% versus 15.6%.
- The Midlands accounts for 18.9% of mapped newest-cohort headquarters versus 20.3% of the pre-2000 cohort.
- Yorkshire accounts for 13.2% of mapped newest-cohort headquarters versus 3.1% of the pre-2000 cohort.
- North West representation is 13.2% of mapped newest-cohort headquarters versus 17.2% in the pre-2000 cohort.
Industry angles
- Food and Drink: 40.3% of the newest cohort versus 11.8% of the pre-2000 cohort.
- Business Consultancy, Services and Support: 9.7% of the newest cohort versus 9.7% of the pre-2000 cohort.
- Childcare and Children’s Activities: 8.3% of the newest cohort versus 6.5% of the pre-2000 cohort.
- Cleaning Services: 4.2% of the newest cohort versus 18.3% of the pre-2000 cohort.
- Fitness: 2.8% of the newest cohort versus 0.0% of the pre-2000 cohort.
Corrections & evidence
Twine Growth treats the UK Franchise Growth Index as a living research resource. Franchise networks can submit stronger public evidence or factual corrections where information has changed or where the Index record is incomplete.
- Revised location or franchisee counts.
- Updated investment information.
- Recruitment-status changes.
- Leadership changes.
- Operating-model clarification.
- Public URLs or other evidence supporting a correction.
About the research
The UK Franchise Growth Index
The UK Franchise Growth Index is Twine Growth’s structured research asset for analysing the public evidence behind UK franchise networks. It connects network-level data with the Five Fibre Framework™ so individual records can also support market-wide research.
Methodology
Data source: the master UK Franchise Networks Index workbook for the 2026 edition. The analysis uses the 817 networks contained in the workbook and applies the rules below consistently.
- Franchise-start year: the first four-digit year identifiable in the Franchising Started field. Text-only disclosures without a usable year remain missing. Where only a decade is recorded (for example, “2010s”), the first year of that decade is used; 16 of the 352 dated records are recorded this way.
- Cohorts: 2022–2026, 2017–2021, 2010–2016, 2000–2009 and before 2000. All five contain at least 59 networks.
- Industry labels: Food & Drink is normalised to Food and Drink for aggregation. Other categories are retained as recorded unless an obvious duplicate label exists.
- Investment: analysis uses the numeric Investment From field where identifiable. Missing or non-numeric values remain missing.
- Network size: the first numeric value identifiable in Approx Locations is used as an approximate current location count. It is not treated as historic location data.
- Five Fibre Balance: maximum Fibre score minus minimum Fibre score across Assess, Build, Launch, Grow and Amplify.
- Public information completeness: percentage of 12 fields with publicly identifiable values: website, opportunity URL, description, investment from/to, franchisees, locations, franchise director, CEO/founder, company LinkedIn, franchise director LinkedIn and recruitment status.
- Geography: only UK county/region values that can be mapped consistently to a broad region are included in regional comparisons.
- Missing data: missing does not equal zero. Not publicly disclosed, not publicly stated, no public record available and equivalent values are treated as missing.
- Statistical interpretation: descriptive differences are prioritised. Non-parametric or categorical tests are used only as supporting checks and are not treated as proof of causation.
- Rounding: percentages are normally shown to one decimal place; monetary medians are rounded to the nearest pound unless a simpler journalist-facing figure is clearer.
2026 baseline freeze
Twine Growth retains the workbook behind this report as the frozen 2026 baseline. Future editions will preserve stable network identifiers so that Twine Growth can distinguish market-composition change from change within the same networks.
This report uses the shared Index methodology, set out in full in how the UK Franchise Growth Index was created, plus the report-specific method above.
Research limitations
- The Index is built from publicly identifiable evidence and therefore reflects differences in public disclosure as well as underlying franchise characteristics.
- Historical public information is not comprehensively available, so current characteristics must not be projected backwards and described as historic facts.
- Franchise-start dates do not reveal when individual franchise locations opened.
- Approximate franchisee and location counts may be rounded or reported at different dates.
- Investment structures vary and cannot always be reduced cleanly to a single comparable figure.
- International brands may report UK and global network information differently.
- Smaller subgroups are not used for standalone claims where the sample is insufficient.
- Associations and cohort differences do not prove causation.
- Five Fibre scores reflect the UK Franchise Growth Index methodology and should not be interpreted as measures of profitability, franchisee earnings, satisfaction, legal compliance or investment quality.
For journalists
- Report
- UK Franchise Trends Report
- Publisher
- Twine Growth
- Publication date
- 30 September 2026
- Research source
- The UK Franchise Growth Index
- Research population
- 817 networks
- Sample for this report
- 352 networks with a usable franchise start year
- Data snapshot
- 22 September 2026
- Methodology
- Methodology for this report and the Index methodology
- Permanent link
- https://www.twinegrowth.com/uk-franchise-growth-index/reports/uk-franchise-trends-report/
- Media enquiries
- Contact Twine Growth
Source: Twine Growth, the UK Franchise Growth Index
Corrections and updates
- Published
- 30 September 2026
- Last updated
- 1 October 2026
- Version
- 1.0 (PDF version 1.0)
- Data snapshot
- 22 September 2026
No corrections have been issued for this edition.
If you represent a franchise network and something in this report is wrong or out of date, send us the evidence and we will review it. Corrections are recorded here, and the page address never changes.