Executive summary
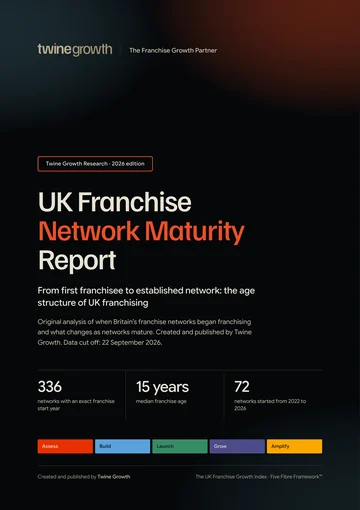
Starting a franchise network is one thing. Building one that lasts is another. This report maps the age structure of the current UK franchise landscape using the year each network began franchising, then tests how size, investment, operating model, recruitment and Five Fibre characteristics differ across maturity stages.
Eight headline findings
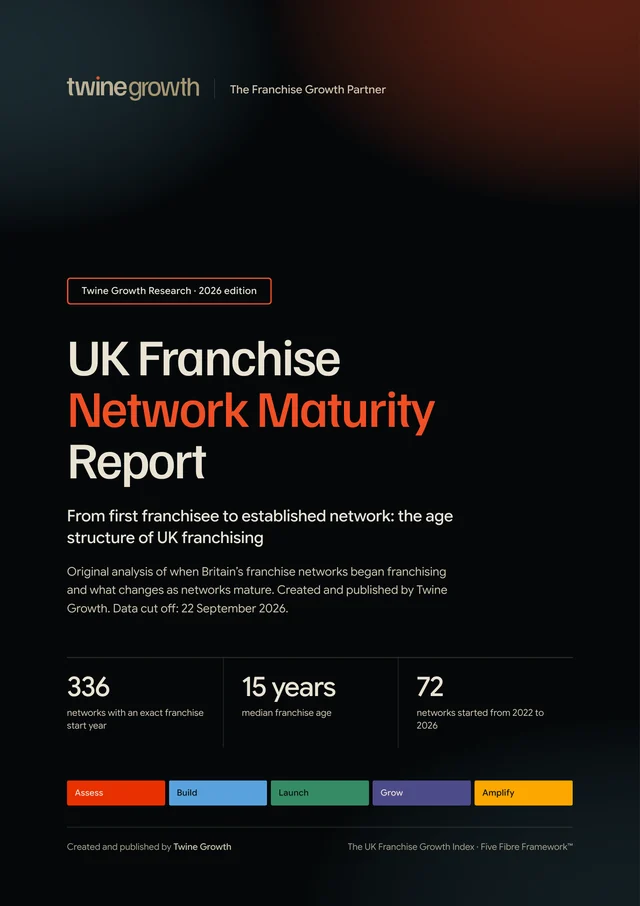
- Only 336 of 817 networks (41.1%) have an exact franchise start year that can be used for year level maturity analysis. The remaining records are retained as missing rather than estimated.
- The median age among networks with an exact start year is 15 years. Half of the usable population began franchising in 2011 or later.
- 72 networks, 21.4% of the usable population, began franchising from 2022 to 2026. This is also the strongest five year formation window represented in the current Index.
- 127 networks (37.8%) have been franchising for at least 20 years, while 77 (22.9%) have operated for at least 30 years.
- Food and Drink has the youngest median age among industries with at least ten exact dated networks, at 5.5 years. Estate and Letting Agents has the oldest median at 30.5 years.
- Reported current network size rises across the maturity cohorts where numeric location data is available, from a median of 7.5 locations in the New Generation cohort to 130 in the Long Standing cohort. This is association, not a historical growth curve.
- Minimum investment does not rise in a straight line with maturity. The median ranges from £17,273 to £30,000 across cohorts with usable investment data.
- Five Fibre scores rise with maturity in this cross sectional dataset, with Grow showing the strongest correlation with franchise age at 0.45. This does not demonstrate that age causes stronger foundations.
Important data note: the Index does not contain a dedicated franchise fee field, so this report does not calculate franchise fees or infer them from minimum investment.
Key findings
The median franchise age among the 336 exact dated networks analysed by Twine Growth is 15 years.
72 of 336 exact dated networks, or 21.4%, began franchising from 2022 to 2026.
128 of 336 exact dated networks, or 38.1%, began franchising within the last ten years.
127 of 336 exact dated networks, or 37.8%, have been franchising for at least 20 years.
77 of 336 exact dated networks, or 22.9%, have been franchising for at least 30 years.
25 of 336 exact dated networks, or 7.4%, have been franchising for at least 40 years.
More findings from the report
- 2.4%8 of 336 exact dated networks, or 2.4%, have been franchising for at least 50 years.
- The earliest exact franchise start year recorded in the Index is 1956, while the latest is 2026.
- 90 of 336The 2010s account for 90 of the 336 exact dated current networks, compared with 94 from 2020 onwards.
- 5.5Food and Drink has a median franchise age of 5.5 years across 66 exact dated networks.
- 30.5Estate and Letting Agents has a median franchise age of 30.5 years across 14 exact dated networks.
- £25,000The New Generation cohort has a median minimum investment of £25,000 across 49 usable investment records.
- £30,000The Long Standing cohort has a median minimum investment of £30,000 across 64 usable investment records.
- 7.5The New Generation cohort has a median of 7.5 current locations across 30 numeric location records.
- 130The Long Standing cohort has a median of 130 current locations across 39 numeric location records.
- 126 of 127126 of the 127 exact dated networks aged 20 years or more are recorded as publicly active, recruiting, selective or limited.
- 0.45Grow has the strongest Five Fibre correlation with franchise age at 0.45 across the 336 exact dated networks.
- 10.3The average Grow score rises from 10.3 in the New Generation cohort to 14.4 in the Long Standing cohort.
- 481 of 817An exact franchise start year is unavailable for 481 of the 817 networks, so those records are excluded from year level maturity analysis rather than estimated.
- 336 of 817Analysis by Twine Growth found that 336 of the 817 franchise networks in the UK Franchise Growth Index have an exact usable franchise start year.
Every finding is from Twine Growth’s analysis of the UK Franchise Growth Index. The base for each figure is stated in the finding itself.
Defining franchise maturity
What Franchise Network Maturity means
Franchise Network Maturity is the length of time that has passed since a business began operating as a franchise network, measured from its publicly identified franchise start year.
Maturity describes time within franchising. It does not automatically describe quality, success, profitability, financial stability, franchisee satisfaction, growth potential, investment quality, brand awareness or Five Fibre strength.
The Twine Growth Franchise Maturity Model
| Maturity stage | Franchise age | Networks | Share of usable population |
|---|---|---|---|
| New Generation | 0 to 4 years | 72 | 21.4% |
| Developing | 5 to 9 years | 56 | 16.7% |
| Established | 10 to 19 years | 81 | 24.1% |
| Mature | 20 to 29 years | 50 | 14.9% |
| Long Standing | 30+ years | 77 | 22.9% |
The recommended bands produce five sizeable cohorts in this dataset, so they are retained for the report. They are descriptive age groups only.
When today’s networks began franchising
The age of UK franchising
The timeline shows the start years of networks that are present in today’s Index. It does not show every franchise system ever launched in the UK. Networks that ceased trading are generally absent, creating survivorship bias.
Formation by period
| Franchise start period | Networks | Share of exact dated population |
|---|---|---|
| Before 1970 | 7 | 2.1% |
| 1970s | 5 | 1.5% |
| 1980s | 19 | 5.7% |
| 1990s | 58 | 17.3% |
| 2000s | 63 | 18.8% |
| 2010s | 90 | 26.8% |
| 2020 onwards | 94 | 28.0% |
When was the current landscape built?
The strongest formation window in the current Index
The highest single exact start year is 2026 with 16 current networks. The strongest five year window is 2022 to 2026 with 72 networks. The 2020 onwards period contains the largest total, with 94 exact dated current networks, narrowly ahead of the 2010s with 90.
The generations of UK franchising
The New Generation
Food and Drink accounts for 29 of the 72 New Generation networks with exact dates. Business Consultancy, Services and Support contributes seven, while Childcare and Children’s Activities contributes six. These counts describe the current Index population rather than all franchise launches during the period.
The established core
208 networks with exact dates have been franchising for at least ten years, equal to 61.9% of the usable population. Their median age is 23.5 years.
The 20, 30, 40 and 50 year clubs
Longevity is factual, but it is not a quality judgement. Some long standing networks are large, some remain deliberately compact, and current size is only a snapshot.
Britain’s longest standing exact dated networks
| Network | Started | Age | Industry · category |
|---|---|---|---|
| SPAR UK | 1956 | 70 | Retail · Store Franchise |
| Londis | 1959 | 67 | Retail · Store Franchise |
| ServiceMaster Clean Contract Services | 1959 | 67 | Cleaning Services · Commercial Cleaning Franchise |
| ServiceMaster Restore | 1959 | 67 | Cleaning Services · Specialist Cleaning Franchise |
| Dyno Rod | 1963 | 63 | Maintenance, Building, Plumbing and Gardening · Drainage Franchise |
| KFC UK and Ireland | 1965 | 61 | Food and Drink · Quick Service Franchise |
| Snap-on Tools UK | 1965 | 61 | Automotive · Mobile Automotive Franchise |
| Apollo Blinds | 1972 | 54 | Home Improvement and Renovations · Interior Franchise |
| Nisa Retail | 1977 | 49 | Retail · Store Franchise |
| Safeclean | 1977 | 49 | Cleaning Services · Specialist Cleaning Franchise |
| Autosmart International | 1979 | 47 | Automotive · Appearance Franchise |
| Tumble Tots | 1979 | 47 | Childcare and Children’s Activities · Early Years Franchise |
This table uses the exact franchise start year recorded in the Index. Some early dates may reflect when a brand began franchising internationally rather than in the UK.
How franchise generations differ
Industry maturity
Among industries with at least ten exact dated networks, Food and Drink has the youngest median franchise age at 5.5 years. Estate and Letting Agents has the oldest at 30.5 years, followed by Maintenance, Building, Plumbing and Gardening at 28 years and Cleaning Services at 26 years.
Industry detail
| Industry | n | Median age | Mean age | 0 to 4 years | 20+ years |
|---|---|---|---|---|---|
| Food and Drink | 66 | 5.5 | 11.1 | 43.9% | 19.7% |
| Care | 21 | 9.0 | 12.0 | 9.5% | 19.0% |
| Home Improvement and Renovations | 13 | 9.0 | 17.0 | 30.8% | 38.5% |
| Childcare and Children’s Activities | 48 | 12.0 | 15.0 | 12.5% | 29.2% |
| Fitness | 14 | 13.0 | 12.6 | 14.3% | 14.3% |
| Business Consultancy, Services and Support | 25 | 16.0 | 16.7 | 28.0% | 36.0% |
| Education and Tuition | 14 | 16.0 | 16.4 | 14.3% | 21.4% |
| Retail | 14 | 25.5 | 28.8 | 7.1% | 64.3% |
| Cleaning Services | 32 | 26.0 | 26.5 | 9.4% | 56.3% |
| Maintenance, Building, Plumbing and Gardening | 13 | 28.0 | 27.9 | 7.7% | 76.9% |
| Estate and Letting Agents | 14 | 30.5 | 26.4 | 7.1% | 64.3% |
How the industry mix changes
The current Index suggests a clear generational shift in composition. Food and Drink is heavily represented among newer exact dated networks, while Retail, Estate and Letting Agents, Cleaning Services and Maintenance related concepts contain a larger share of long standing networks. This is a composition finding, not evidence that one industry is more successful than another.
The changing franchise business model
Premises based concepts account for 56.9% of New Generation networks with exact dates, compared with 38.0% of Mature networks and 48.1% of Long Standing networks. Home based status peaks in the Mature cohort at 58.0%. Mobile concepts range from 29.2% of New Generation networks to 40.3% of Long Standing networks.
Because the Index records these operating model flags for every row, these comparisons have broader coverage than location count or investment comparisons.
Investment, size and recruitment
Minimum investment across the lifecycle
| Cohort | Age | Usable investment records | Median minimum investment |
|---|---|---|---|
| New Generation | 0 to 4 years | 49 | £25,000 |
| Developing | 5 to 9 years | 44 | £24,995 |
| Established | 10 to 19 years | 66 | £17,273 |
| Mature | 20 to 29 years | 41 | £19,995 |
| Long Standing | 30+ years | 64 | £30,000 |
The investment pattern is not linear. Established networks have the lowest cohort median at £17,273, while Long Standing networks have the highest at £30,000. Age and minimum investment have only a weak positive correlation of 0.12 among the 264 exact dated networks with usable numeric investment data.
Franchise fees
A dedicated franchise fee field is not present in the Index. The report therefore does not attempt to estimate franchise fees from minimum investment, investment ranges or public descriptions. This preserves the distinction between the capital required to enter an opportunity and any separate franchise fee.
Current network size and maturity
| Cohort | Numeric location records | Median current locations |
|---|---|---|
| New Generation | 30 | 7.5 |
| Developing | 17 | 22 |
| Established | 22 | 84 |
| Mature | 24 | 100 |
| Long Standing | 39 | 130 |
Numeric location data is available for 132 of the 336 exact dated networks. Within that subset, median current locations increase from 7.5 in the New Generation cohort to 130 among Long Standing networks. The correlation between age and current reported locations is 0.23.
This must not be described as the time required to reach a particular scale. The Index does not contain historical year by year location counts.
Small but mature and young but scaling
These cohorts show why age and scale need to be separated. A mature network can remain compact by design, while a young network can already report a larger footprint. Neither pattern is a quality judgement.
Recruitment does not stop with age
| Age threshold | Networks | Publicly recruiting / active | Share |
|---|---|---|---|
| 20+ years | 127 | 126 | 99.2% |
| 30+ years | 77 | 76 | 98.7% |
| 40+ years | 25 | 25 | 100.0% |
Recruitment status in the Index is overwhelmingly active. Among exact dated networks aged 20 years or more, 126 of 127 are recorded as active, recruiting, selective or limited. This means the field is useful for showing continued recruitment activity, but it offers limited variation for explaining maturity differences.
Maturity through the Five Fibres
How the Five Fibre profile changes
| Cohort | Assess | Build | Launch | Grow | Amplify | Overall |
|---|---|---|---|---|---|---|
| New Generation | 15.1 | 15.4 | 15.0 | 10.3 | 13.5 | 69.3 |
| Developing | 16.6 | 16.7 | 15.4 | 12.5 | 14.5 | 75.8 |
| Established | 17.6 | 17.7 | 16.5 | 14.0 | 15.9 | 81.7 |
| Mature | 18.1 | 18.1 | 16.9 | 14.5 | 16.3 | 84.0 |
| Long Standing | 17.7 | 17.7 | 16.6 | 14.4 | 15.9 | 82.4 |
All five average Fibre scores are higher in older cohorts than in the New Generation cohort. The largest absolute difference between New Generation and Long Standing networks appears in Grow, rising from 10.3 to 14.4 out of 20.
Does age equal stronger foundations?
| Measure | Correlation with franchise age |
|---|---|
| Assess | 0.37 |
| Build | 0.34 |
| Launch | 0.31 |
| Grow | 0.45 |
| Amplify | 0.32 |
| Overall Five Fibre | 0.38 |
Grow has the strongest observed relationship with age at 0.45, followed by the overall Five Fibre score at 0.38. These are moderate associations within a cross sectional dataset. They do not prove that getting older causes a stronger Five Fibre profile.
Transparency, geography and data quality
Public information completeness
| Cohort | Average completeness across seven selected public fields |
|---|---|
| New Generation | 83.1% |
| Developing | 82.9% |
| Established | 82.5% |
| Mature | 86.6% |
| Long Standing | 87.8% |
Using a seven field completeness measure covering exact franchise start year, numeric minimum investment, numeric location count, clear recruitment status, operating model flags, headquarters town or city and headquarters county or region, Long Standing networks have the highest average completeness at 87.8%. Established networks have the lowest at 82.5%, and New Generation networks average 83.1%.
The missing history problem
An exact franchise start year is unavailable for 481 of the 817 networks in the Index. This includes records described as “Not publicly disclosed”, “Not publicly stated”, “Not publicly listed”, decade only references and other non exact entries. Those records are excluded from year level maturity calculations rather than assigned an estimated date.
Maturity by headquarters region
| Headquarters county or region | n | Median age | 0 to 4 years | 20+ years |
|---|---|---|---|---|
| London | 40 | 9.5 | 30.0% | 30.0% |
| Leicestershire | 14 | 20.5 | 21.4% | 50.0% |
| West Midlands | 12 | 14.5 | 25.0% | 41.7% |
| West Yorkshire | 12 | 10.0 | 33.3% | 25.0% |
| Greater Manchester | 11 | 24.0 | 36.4% | 54.5% |
| Cheshire | 10 | 23.5 | 10.0% | 60.0% |
This geography uses network headquarters, not franchisee or outlet locations. London has the largest exact dated sample among the regions meeting the ten network threshold, with a median age of 9.5 years. Greater Manchester has the oldest median among these listed regions at 24 years.
What surprised us
- The strongest five year formation window represented in the current Index is the most recent one: 2022 to 2026, with 72 exact dated networks.
- Half of exact dated networks began franchising in 2011 or later, despite the Index containing networks with franchise histories reaching back to 1956.
- Food and Drink combines the largest exact dated industry sample with the youngest median age among industries with at least ten usable records.
- Long Standing networks still show near universal public recruitment activity in the Index: 76 of 77 are recorded as active, recruiting, selective or limited.
- Minimum investment shows only a weak relationship with age, while Grow has a much stronger relationship with maturity than investment does.
Ten things we learned
- 01336 of 817 networks (41.1%) have an exact usable franchise start year.
- 02The median exact dated network is 15 years old.
- 0372 networks began franchising from 2022 to 2026.
- 04127 exact dated networks have been franchising for at least 20 years.
- 0577 have been franchising for at least 30 years.
- 0625 have been franchising for at least 40 years.
- 078 have been franchising for at least 50 years.
- 08The 2020 onwards period contains 94 exact dated current networks, the largest period group.
- 09Among industries with at least ten exact dated networks, median age ranges from 5.5 years in Food and Drink to 30.5 years in Estate and Letting Agents.
- 10Grow has a 0.45 correlation with franchise age, the strongest of the five Fibre relationships in this dataset.
Methodology
Methodology and research integrity
- The UK Franchise Growth Index 2026 workbook contains 817 franchise networks and is the primary source.
- An exact franchise start year is treated as usable when a specific four digit year can be extracted from the Franchising Started field. Decade only references such as “2010s” are not treated as exact years.
- Franchise age is calculated as 2026 minus the recorded franchise start year. Exact anniversary dates are not available, so age is expressed in whole calendar years.
- The maturity model uses five cohorts: 0 to 4 years, 5 to 9 years, 10 to 19 years, 20 to 29 years and 30 years plus.
- Business founding year and franchise start year are kept separate. Company formation dates are never substituted for missing franchise start dates.
- Numeric network size is used only where a number can be extracted from Approx Locations without relying on broad descriptors such as “UK network” or “national network”.
- Minimum investment is taken from Investment From where numeric. Text such as “Not publicly disclosed” remains missing.
- Recruitment is treated as active where the Index records Active, Recruiting, Selective, Limited or Recruiting UK Area Developers.
- Operating model analysis uses the Home Based, Mobile and Retail Premises yes or no fields exactly as supplied.
- Headquarters analysis uses network headquarters and never franchisee or outlet locations.
- Five Fibre analysis uses the Assess, Build, Launch, Grow and Amplify scores already held in the Index.
- The Public Information Completeness measure uses seven selected fields: exact franchise start year, numeric minimum investment, numeric location count, clear recruitment status, complete operating model flags, headquarters town or city and headquarters county or region.
- Means are reported alongside medians, but medians are preferred for skewed commercial fields such as investment and network size.
- No missing value is converted to zero. No franchise start year is estimated.
- Correlations describe association only. They do not establish causation.
- Location counts: where an Approx Locations value contains a number, the first number in it is taken as the network’s current location count. On this reading, 132 of the 336 exact dated networks have a numeric location count.
An important date distinction
Year the business was founded and year the business began franchising are not interchangeable. A business may trade for many years before recruiting its first franchisee. Every maturity calculation in this report uses the franchise start year only.
Survival must not be confused with formation
The UK Franchise Growth Index contains networks identified within the current UK franchise landscape. It does not contain every franchise business ever launched. Therefore, the number of current networks that began franchising in a particular year is not the same as the total number of franchise systems launched in that year. Networks that later closed will normally be absent, creating survivorship bias.
This report uses the shared Index methodology, set out in full in how the UK Franchise Growth Index was created, plus the report-specific method above.
Research limitations
- Public franchise start dates can be incomplete or inconsistently described.
- International networks may record a global franchise start year or a UK specific start year. The report uses the value held in the Index.
- Current network size is a snapshot, not historical growth data.
- Recruitment status, investment and franchise ownership can change.
- Rebrands, acquisitions and relaunches can complicate historical continuity.
- The absence of public evidence is not proof that information or infrastructure does not exist internally.
- Longevity does not establish commercial quality, investment suitability or future performance.
For journalists
- Report
- UK Franchise Network Maturity Report
- Publisher
- Twine Growth
- Publication date
- 30 September 2026
- Research source
- The UK Franchise Growth Index
- Research population
- 817 networks
- Sample for this report
- 336 networks with an exact franchise start year
- Data snapshot
- 22 September 2026
- Methodology
- Methodology for this report and the Index methodology
- Permanent link
- https://www.twinegrowth.com/uk-franchise-growth-index/reports/uk-franchise-network-maturity-report/
- Media enquiries
- Contact Twine Growth
Source: Twine Growth, the UK Franchise Growth Index
Media story angles
- National business: How old is Britain’s franchise network landscape?
- Franchise: What changes as a franchise network matures?
- Entrepreneurship: The new generation of British franchise brands.
- Small business: How long standing franchise networks compare with newer concepts.
- Investment: How minimum franchise investment differs across network generations.
- Future of work: How home based and mobile models vary by franchise generation.
- Growth: What current network size looks like at different stages of franchise maturity.
- Regional: Where Britain’s newest franchise networks are headquartered.
- Industry: Which sectors contain Britain’s youngest and oldest exact dated networks?
- Digital: How public information completeness differs across maturity cohorts.
The central editorial story
Franchise maturity is not about being old. It is about understanding where a network sits in its franchise journey.
The Index makes it possible to examine all 817 networks individually and reconstruct the age structure of today’s UK franchise landscape. The report therefore owns a distinct research territory: time. It shows when today’s networks began franchising, how their characteristics differ between generations and where the evidence is strong enough to support comparison.
Corrections and updates
- Published
- 30 September 2026
- Last updated
- 1 October 2026
- Version
- 1.0 (PDF version 1.0)
- Data snapshot
- 22 September 2026
No corrections have been issued for this edition.
If you represent a franchise network and something in this report is wrong or out of date, send us the evidence and we will review it. Corrections are recorded here, and the page address never changes.