Executive summary
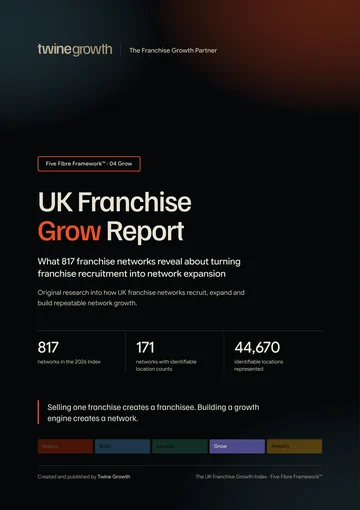
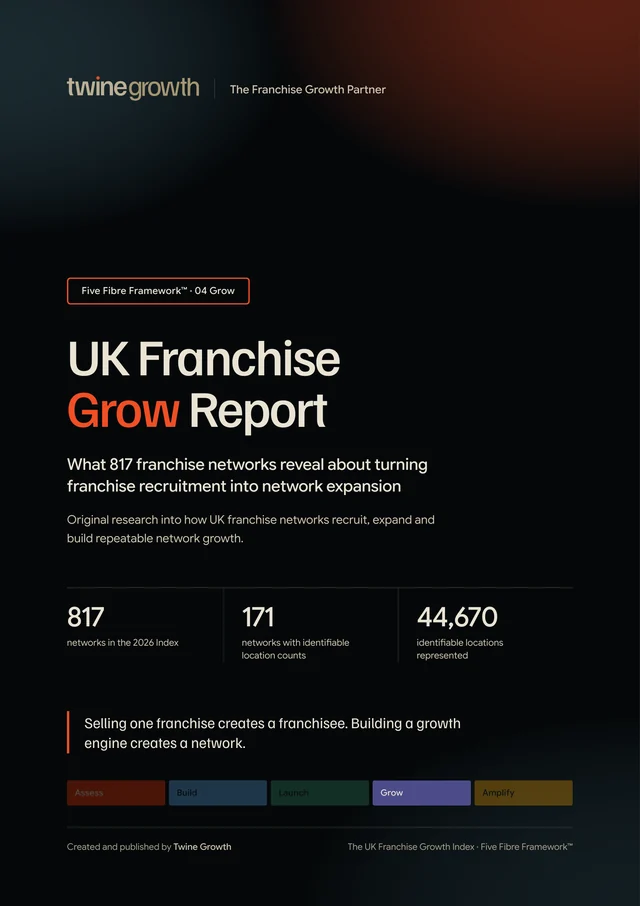
This report analyses all 817 networks in the UK Franchise Growth Index. Location counts could be identified consistently for 171 networks, representing approximately 44,670 locations. The report therefore separates whole Index findings from location based findings rather than filling gaps with estimates.
- 118 of 171 networks with identifiable location counts (69.0%) have reached at least 25 locations.
- 94 of 171 (55.0%) have reached at least 50 locations.
- 62 of 171 (36.3%) have reached at least 100 locations.
- 809 of 817 networks (99.0%) are recorded as actively recruiting, recruiting, limited, selective or recruiting UK area developers.
- Grow has its strongest cross fibre relationship with Amplify in this dataset (r=0.89), closely followed by Launch (r=0.89).
- Grow Score has only a weak relationship with identifiable network size in the available location subset (r=0.14, n=171). This is an association, not a causal result.
Key findings
Location counts were numerically identifiable for 171 networks, representing approximately 44,670 locations.
The median network in the location evidenced subset had 60 identifiable locations, compared with a mean of 261.2.
118 of 171 location evidenced networks (69.0%) had at least 25 locations.
94 of 171 (55.0%) had at least 50 locations.
62 of 171 (36.3%) had at least 100 locations.
31 of 171 (18.1%) had at least 250 locations.
More findings from the report
- 8.8%15 of 171 (8.8%) had at least 500 locations.
- 13/20The median Grow Score across all 817 networks was 13 out of 20.
- 0.890Grow Score correlated most strongly with Amplify (r=0.890) and Launch (r=0.887) in the Index.
- 4.32Among 132 networks with both a usable franchising start year and location count, median approximate expansion velocity was 4.32 locations per year.
- 817Twine Growth analysed 817 franchise networks in the UK Franchise Growth Index for the UK Franchise Grow Report.
Every finding is from Twine Growth’s analysis of the UK Franchise Growth Index. The base for each figure is stated in the finding itself.
What Grow means
Within the Five Fibre Framework™, Grow asks whether franchise recruitment can become consistent, measurable and repeatable rather than depending on chance, referrals or the founder personally driving every conversation.
- Generate franchise enquiries consistently every month
- Track where franchise enquiries come from
- Know enquiry to franchisee conversion
- Plan which locations or territories to grow into next
- Continue recruitment without relying on the founder to drive every conversation
For this report, Grow is defined as the ability of a franchise network to turn franchise recruitment into consistent, measurable and repeatable network expansion.
What the master Index can prove
The master Index contains 817 franchise networks and a complete Grow Score for every network. It also contains recruitment status, investment, operating model flags, industry, founding information and Five Fibre scores.
However, only 171 records contain an Approx Locations value that can be converted into a numerical location count. That means location based analysis in this report uses n=171, not the full 817.
The dataset does not contain the supplementary live website audit fields a full Grow audit would need, such as territory maps, enquiry click distance, prospectus availability, enquiry form type or dedicated recruitment contacts. Those findings are deliberately not invented.
The identifiable network landscape
The mean is more than four times the median because a small number of very large networks pull the average upwards. For that reason, this report uses medians and milestone distributions alongside means.
Growth milestones
The location evidenced subset shows how quickly the number of networks narrows as the scale threshold rises.
| Identifiable locations | Networks | Share of n=171 |
|---|---|---|
| 10+ | 139 | 81.3% |
| 25+ | 118 | 69.0% |
| 50+ | 94 | 55.0% |
| 100+ | 62 | 36.3% |
| 250+ | 31 | 18.1% |
| 500+ | 15 | 8.8% |
These figures describe the location evidenced subset only. They do not imply that networks outside this subset have fewer locations.
The first ten is not the finish line
Within the networks where location counts are available, most have already moved beyond the very earliest stage. The more revealing drop happens as the thresholds rise: 69.0% reach 25+, 55.0% reach 50+, and 36.3% reach 100+.
Time and scale
Older franchise cohorts are generally larger in the location evidenced subset.
| Franchising started | n | Median locations | Mean locations | 100+ |
|---|---|---|---|---|
| Before 1990 | 12 | 130 | 411.8 | 66.7% |
| 1990–1999 | 31 | 115 | 825.5 | 64.5% |
| 2000–2009 | 29 | 100 | 242.1 | 51.7% |
| 2010–2014 | 10 | 90 | 86.2 | 40.0% |
| 2015–2019 | 12 | 28 | 109.2 | 33.3% |
| 2020 onwards | 38 | 11 | 29.9 | 5.3% |
This pattern is descriptive. Time gives a network more opportunity to expand, but it does not establish why one network grows faster than another.
Size and speed are different questions
Network Expansion Velocity is calculated here as current identifiable locations divided by years since the recorded Franchising Started year. It is an approximate cross sectional measure, not a reconstruction of historical openings.
The large gap between the median and mean again shows the effect of a relatively small number of very large or rapidly expanded networks.
Operating model
Physical format changes the shape of scale. These categories overlap, so they should not be added together or read as a hierarchy of better and worse franchise models.
| Operating model | Location evidenced n | Median locations |
|---|---|---|
| Home based | 78 | 50 |
| Mobile | 58 | 40 |
| Retail premises | 86 | 70 |
| Management | 114 | 60 |
| Executive | 115 | 60 |
Investment and scale need to be read together
| Investment from | n | Median locations | 100+ locations |
|---|---|---|---|
| Under £10k | 30 | 63 | 33.3% |
| £10k–£24,999 | 35 | 35 | 28.6% |
| £25k–£49,999 | 34 | 77 | 41.2% |
| £50k–£99,999 | 13 | 30 | 23.1% |
| £100k+ | 32 | 100 | 56.3% |
Investment is associated with industry and operating model, so this table should not be read as evidence that investment level causes scale.
The median Grow Score is 13 out of 20
The Five Fibre scorecard treats 9 to 12 as Developing and 13 to 16 as Strong. The Index median sits directly at the transition between those two bands, on the lowest score of the Strong band.
A Grow Score describes the evidence captured in the Index against the Grow criteria. It should not be treated as a measure of franchise profitability, franchisee satisfaction or investment attractiveness.
Grow moves most closely with Launch and Amplify
| Relationship with Grow | Correlation r |
|---|---|
| Assess | 0.853 |
| Build | 0.867 |
| Launch | 0.887 |
| Amplify | 0.890 |
| Identifiable locations | 0.145 |
The strong cross fibre correlations show that Grow rarely sits in isolation inside the Index. The much weaker location relationship is a reminder that current network size is influenced by age, industry, operating model and many factors not captured by a single score.
Grow cannot be separated from what comes before and after it
Grow and Launch have a correlation of r=0.89. Grow and Amplify have a correlation of r=0.89. These are the two strongest relationships with Grow in the Index.
Launch is about taking the franchise proposition to market. Grow is about turning recruitment into a repeatable engine. Amplify is about helping each franchise location build local customer demand. The data supports treating these as connected stages, while not proving that strength in one causes strength in another.
Grow differs by industry, but not dramatically
| Industry | Networks | Mean Grow Score |
|---|---|---|
| Food and Drink | 163 | 11.97 |
| Childcare and Children’s Activities | 115 | 12.95 |
| Business Consultancy, Services and Support | 69 | 11.38 |
| Cleaning Services | 66 | 12.56 |
| Retail | 42 | 13.00 |
| Care | 36 | 13.07 |
| Education and Tuition | 36 | 12.28 |
| Fitness | 32 | 12.89 |
| Estate and Letting Agents | 31 | 13.27 |
| Home Improvement and Renovations | 30 | 12.08 |
| Maintenance, Building, Plumbing and Gardening | 29 | 12.55 |
| Automotive | 28 | 12.00 |
The largest industry groups cluster within a relatively narrow Grow Score range. Industry context matters, but the Index does not support reducing Grow to a simple sector ranking.
A network is built by repetition
A franchise does not become a network because it recruits one franchisee.
It becomes a network when it can do it again. And again. And again.
Without depending on chance. Without depending on one campaign. Without depending on the founder personally driving every conversation.
That is the difference between franchise recruitment and repeatable franchise growth.
That is Grow.
Methodology
How the analysis was built
- Master Index population: 817 networks.
- Location evidenced population: 171 records with an Approx Locations field from which a numerical count could be extracted.
- Identifiable locations represented: approximately 44,670.
- Data cut off: master Index dated 23 September 2026.
- Grow Score: the existing Twine Growth Grow Score contained in the master Index, maximum 20.
- Recruitment active grouping: Active, Recruiting, Limited, Selective and Recruiting UK Area Developers.
- Network Expansion Velocity: current identifiable locations divided by elapsed years since the recorded Franchising Started year, with a minimum denominator of one year.
- Correlations: Pearson correlation, reported as descriptive association only.
- Missing values were excluded from calculations requiring that field. They were not converted to zero.
- Approximate or qualified location descriptions were converted using the first numerical value stated. This preserves the Index evidence but means totals should be read as approximate.
This report uses the shared Index methodology, set out in full in how the UK Franchise Growth Index was created, plus the report-specific method above.
Research limitations
What this edition does not claim
- It does not claim that a large network is a better franchise.
- It does not equate network size with profitability or franchisee satisfaction.
- It does not infer missing location counts.
- It does not claim that correlation proves causation.
- It does not claim a public website lacks territory planning, enquiry infrastructure or recruitment systems when those fields are not contained in the master Index.
- It does not publish a best or worst franchise ranking.
A future supplementary Grow audit can add territory availability, recruitment infrastructure, enquiry distance, public recruitment transparency and regional expansion demand. Those fields are not consistently present in the master Index, so they are outside the evidence base of this edition.
For journalists
- Report
- UK Franchise Grow Report
- Publisher
- Twine Growth
- Publication date
- 30 September 2026
- Research source
- The UK Franchise Growth Index
- Research population
- 817 networks
- Sample for this report
- 817 networks; 171 with a usable location count
- Data snapshot
- 23 September 2026
- Methodology
- Methodology for this report and the Index methodology
- Permanent link
- https://www.twinegrowth.com/uk-franchise-growth-index/reports/uk-franchise-grow-report/
- Media enquiries
- Contact Twine Growth
Source: Twine Growth, the UK Franchise Growth Index
For journalists and publishers
Preferred attribution: “Analysis by Twine Growth of the UK Franchise Growth Index found…”
Recommended link destination: the UK Franchise Grow Report page on the Twine Growth website, twinegrowth.com/uk-franchise-growth-index/reports/uk-franchise-grow-report/
- Full report and methodology
- Supporting data cuts where the underlying Index supports them
- Industry and operating model analysis
- High resolution charts and graphics
- Commentary from Twine Growth founders
- Clarification of definitions, denominators and limitations
Source line for charts and extracts: Source: Twine Growth, the UK Franchise Growth Index.
Corrections and updates
- Published
- 30 September 2026
- Last updated
- 1 October 2026
- Version
- 1.0 (PDF version 1.0)
- Data snapshot
- 23 September 2026
No corrections have been issued for this edition.
If you represent a franchise network and something in this report is wrong or out of date, send us the evidence and we will review it. Corrections are recorded here, and the page address never changes.