Executive summary
This report asks a narrow question with a wide commercial consequence: once a franchise has built the foundations to operate, has it built the infrastructure to grow at the same strength?
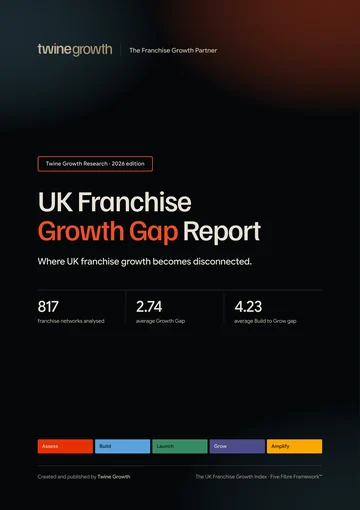
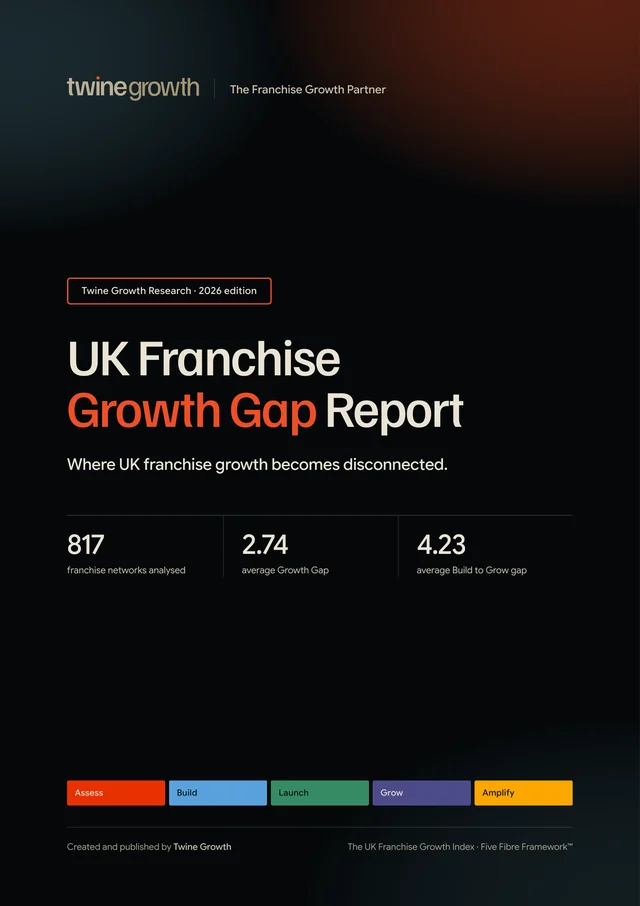
Across all 817 networks, the average of Assess, Build and Launch is 16.17 out of 20. The average of Grow and Amplify is 13.43. The difference is 2.74 points. This report defines that difference as the Growth Gap.
The clearest signal is Grow. Its average score is 12.30, the lowest of all five fibres. Build exceeds Grow in every one of the 817 networks. Grow is also at or below the minimum fibre score in 816 records.
The pattern is not confined to lower confidence records. Among the 267 records rated High confidence, the average Growth Gap is 2.62 points and the average Build to Grow gap is 4.05.
Key findings
Across all 817 networks, the average Growth Gap is 2.74 points out of 20.
Build scores higher than Grow in all 817 networks.
The average Build to Grow difference is 4.23 points.
Launch scores higher than Grow in all 817 networks.
Amplify scores higher than Grow in 815 of 817 networks, or 99.8%.
798 of 817 networks, or 97.7%, meet the report definition of a double growth gap.
More findings from the report
- 33.4%273 of 817 networks, or 33.4%, have a Growth Gap of at least three points.
- 4.55The average fibre spread across all 817 networks is 4.55 points.
- 3.50Among 255 networks with an exact franchising start year, networks aged 0 to 5 years show a 3.50 average Growth Gap compared with 2.32 for networks aged 21 years or more.
- 3.04Among 325 records with a parseable franchisee count, networks with 1 to 9 franchisees average a 3.04 Growth Gap compared with 2.29 for networks with 100 or more.
- 2.62Among the 267 High confidence records, the average Growth Gap remains 2.62 points.
Every finding is from Twine Growth’s analysis of the UK Franchise Growth Index. The base for each figure is stated in the finding itself.
The Growth Gap
The Growth Gap defined
One calculation, used consistently
Growth Gap = average score across Assess, Build and Launch minus average score across Grow and Amplify.
The first group represents the publicly evidenced foundations used to assess, build and launch a franchise proposition. The second group represents the publicly evidenced infrastructure used to grow the network and amplify local franchisee growth.
A positive Growth Gap does not mean a franchise is failing. It means the public evidence supporting later stage growth is weaker than the public evidence supporting the earlier foundations.
The Five Fibre shape
Assess and Build are almost identical at 16.52 and 16.53. Launch falls to 15.46. Grow then drops to 12.30, before Amplify recovers to 14.57. The typical shape is therefore not a steady decline. It is a pronounced dip at Grow.
Build to Grow and Launch to Grow
The Build to Grow gap
Every network in the Index scores higher on Build than Grow. The average difference is 4.23 points out of 20. This is one of the most universal disconnects identified in the dataset.
Build measures the systems, brand and operations a franchisee can follow. Grow measures commercial growth, lead quality and conversion. The finding therefore identifies a consistent difference between the public evidence for building the franchise system and the public evidence for scaling franchise recruitment.
Launch to Grow
Launch exceeds Grow in all 817 networks. The average difference is 3.16 points. This suggests the public evidence around testing, onboarding and support is universally stronger than the evidence around repeatable commercial recruitment growth.
Network growth, local growth and the double gap
Network growth and local growth are different
Base: all 817 networks. Grow measures commercial growth, lead quality and conversion. Amplify measures local marketing and support.
Grow averages 12.30. Amplify averages 14.57. Amplify exceeds Grow in 815 records, equal to 99.8% of the Index.
This does not show that local customer growth is universally strong. It shows that the public evidence for local franchisee growth support is generally stronger than the evidence for franchise recruitment growth.
The double growth gap
For this report, a double growth gap exists when both Grow and Amplify score below the average of Assess, Build and Launch for the same network.
By that definition, 798 of 817 networks show a double growth gap. Grow alone sits below the foundation average in all 817 networks. Amplify sits below it in 798.
How large is the gap?
Base: all 817 networks. Small is under 1.5 points. Moderate is 1.5 to under 3. Substantial is 3 points or more.
273 networks, 33.4% of the Index, have a Growth Gap of at least 3 points. A further 511, 62.5%, sit between 1.5 and under 3 points.
These bands are analytical groupings created for this report. They are not quality ratings and should not be interpreted as investment grades.
What sits behind the gap
Balance and the hidden gap
Balance matters
Fibre spread is the difference between a network’s highest and lowest Five Fibre score. It captures balance rather than absolute performance.
The average spread is 4.55 points. 282 networks have a spread of at least five points. This is why one overall score can conceal a meaningful internal disconnect.
The hidden gap
Among the 441 networks with an Overall Five Fibre Score of at least 75, 88 still have a five point or greater difference between their strongest and weakest fibres. 36 have a Grow score of 12 or below.
An overall score is useful for orientation, but the shape underneath it matters. Stronger scores in Assess or Build can mathematically offset a weaker Grow score.
Maturity and network size
Does the gap change with maturity?
Base: 255 networks with an exact four digit public franchising start year. Other records excluded because the year was not precise enough.
Among the 255 networks with an exact franchising start year, the newest group, franchising for five years or less, has an average Growth Gap of 3.50. Networks franchising for 21 years or more average 2.32.
The association is descriptive. The Index does not establish that age causes a smaller gap.
Does the gap change with network size?
Base: 325 records where an approximate franchisee count could be parsed from the public record.
Networks with fewer than 10 recorded franchisees show an average Growth Gap of 3.04. Networks with 100 or more recorded franchisees average 2.29.
The pattern is consistent with a smaller gap at greater scale within this subset, but it is an association rather than evidence of causation.
Investment and operating model
Investment does not remove the gap
| Published investment from | Networks | Avg Growth Gap | Avg Grow | Avg Amplify |
|---|---|---|---|---|
| Under £10k | 109 | 2.67 | 12.29 | 14.66 |
| £10k to £24,999 | 134 | 2.63 | 12.49 | 14.61 |
| £25k to £49,999 | 92 | 2.72 | 12.61 | 14.82 |
| £50k to £99,999 | 43 | 2.78 | 11.95 | 14.21 |
| £100k+ | 70 | 2.50 | 13.44 | 15.49 |
Base: 448 records with a parseable published minimum investment figure.
No simple linear relationship appears across the investment bands. Higher entry investment should therefore not be treated as a proxy for stronger publicly evidenced growth infrastructure.
Operating model
| Model | Yes networks | Yes gap | No networks | No gap |
|---|---|---|---|---|
| Home based | 436 | 2.80 | 381 | 2.67 |
| Mobile | 313 | 2.80 | 504 | 2.70 |
| Retail premises | 350 | 2.61 | 467 | 2.83 |
| Management | 553 | 2.72 | 264 | 2.77 |
| Executive | 567 | 2.71 | 250 | 2.80 |
Differences by operating model are present but modest compared with the universal Build to Grow gap. This suggests the central disconnect is not confined to one franchise format.
Industry patterns
Industries shown only where at least 20 networks are present. This prevents very small categories from dominating the comparison.
Among industries with at least 20 records, Business Consultancy, Services and Support has the largest average Growth Gap at 3.05 points across 69 networks. Care has the smallest within this displayed group at 2.44 across 36 networks.
These figures compare public evidence within the Index. They are not industry quality rankings.
Recruitment, transparency and confidence
The recruitment paradox
802 of the 817 networks are marked Active, Recruiting or Recruiting UK Area Developers. Their average Grow score is 12.33. Build exceeds Grow in 802 of those records.
Recruitment intent and recruitment infrastructure are not the same measure. The Index records a network as recruiting based on public evidence of opportunity availability. Grow assesses the public evidence around commercial growth, lead quality and conversion.
The public transparency gap
| Field | Records without a public answer | Share of Index |
|---|---|---|
| Franchising start year | 458 | 56.1% |
| Approx franchisees | 428 | 52.4% |
| Minimum investment | 355 | 43.5% |
| Franchise director | 459 | 56.2% |
| CEO or founder | 289 | 35.4% |
Missing public information is not evidence that the information does not exist. It records only that the research process could not verify a usable public answer in the relevant field.
Confidence sensitivity check
| Confidence | Networks | Avg Growth Gap | Avg Build to Grow | Avg Grow |
|---|---|---|---|---|
| High | 267 | 2.62 | 4.05 | 11.96 |
| Medium | 456 | 2.78 | 4.35 | 12.74 |
| Low | 94 | 2.89 | 4.19 | 11.15 |
The core finding survives the confidence check. High confidence records still show a material average Growth Gap and Build to Grow gap. This reduces the likelihood that the headline pattern is merely an artefact of lower confidence research records.
What the findings mean
What surprised us
- Build exceeds Grow in every one of the 817 networks.
- Grow is at or below the minimum Five Fibre score in 816 records.
- Amplify exceeds Grow in 815 records, despite Amplify representing the later stage of local franchisee growth.
- 798 networks meet the report definition of a double growth gap.
- Even among networks scoring at least 75 overall, 88 still have a fibre spread of at least five points.
- The gap persists across operating models, confidence levels and the larger industry groups.
Growth assumptions tested
| Question | What the Index shows | Base |
|---|---|---|
| Do older networks have smaller gaps? | Within exact year records, 0 to 5 year networks average 3.50; 21+ year networks average 2.32. | 255 |
| Do larger networks have smaller gaps? | 1 to 9 franchisees average 3.04; 100+ average 2.29. | 325 |
| Does higher investment guarantee a smaller gap? | No simple linear pattern appears across the five published investment bands. | 448 |
| Does active recruitment remove the Grow gap? | No. Publicly recruiting records average 12.33 on Grow and overwhelmingly still score higher on Build. | 802 |
These are descriptive comparisons. None establishes causation.
What the evidence means
The dominant pattern is not a lack of franchise foundations. Assess and Build are the strongest fibres on average. The disconnect appears later, when the franchise needs to turn its proposition into repeatable recruitment growth.
Grow is the pressure point. The evidence suggests that franchise systems are more consistently visible than franchise growth engines. Amplify recovers some of the score, indicating that public evidence around local franchisee growth support is generally stronger than the evidence around recruiting the next franchisee.
For founders and franchise leaders, the practical question is therefore not simply whether the franchise has been built. It is whether the mechanisms for finding, converting and supporting growth have been built with the same strength.
Media and source information
Methodology
Research population
This report analyses all 817 networks in the UK Franchise Growth Index. The Five Fibre assessment date recorded across the dataset is 22 September 2026.
Five Fibre scores
Each network contains scores for Assess, Build, Launch, Grow and Amplify. Each fibre is scored out of 20. The Overall Five Fibre Score is the total across the five fibres.
Growth Gap calculation
For every network, the report calculates the average of Assess, Build and Launch. It then calculates the average of Grow and Amplify. The second figure is subtracted from the first.
Double growth gap
A network is classified as showing a double growth gap when both its Grow score and its Amplify score are below its own average across Assess, Build and Launch.
Fibre spread
Fibre spread is the highest Five Fibre score minus the lowest Five Fibre score for the same network.
Subgroup analysis
Maturity analysis uses only exact four digit franchising start years. Network size analysis uses records where an approximate franchisee count can be parsed. Investment analysis uses records with a parseable published minimum investment figure. Industry comparisons shown in this report require at least 20 networks.
What the Five Fibres measure
The Five Fibre Framework™ is the methodology and spine of the Twine Growth brand. The five fibres are always considered in this fixed order.
Readiness, positioning and market fit, measured before anything is built.
The systems, brand and operations a franchisee can actually follow.
Testing, onboarding and support that make the first successes repeatable.
Commercial growth, lead quality and conversion, scaled the right way.
Local marketing and support so every franchisee grows, not just the network.
Originality and publication context
Twine Growth created this report to quantify a specific relationship inside its proprietary Index: the difference between publicly evidenced franchise foundations and publicly evidenced growth infrastructure.
The distinctive contribution is the Five Fibre comparison across the complete Index dataset, including the Growth Gap calculation, Build to Grow comparison, double growth gap, fibre spread and the subgroup analyses contained in this report.
This report uses the shared Index methodology, set out in full in how the UK Franchise Growth Index was created, plus the report-specific method above.
Research limitations
Limitations and responsible use
- The Index assesses publicly evidenced growth foundations. It does not provide access to confidential internal systems or activity.
- A lower score does not prove that a capability is absent. It means the public evidence researched supports a lower assessment.
- The report does not measure profitability, franchisee satisfaction, financial health, operational quality or investment suitability.
- Subgroup comparisons are descriptive and do not establish causation.
- Approximate franchisee counts and investment figures are used only where the public record provides a parseable value.
- The report is not investment advice and the Five Fibre scores should not be used as a recommendation to buy or avoid any franchise.
- The purpose is to identify systemic patterns, not to shame individual networks.
For journalists
- Report
- UK Franchise Growth Gap Report
- Publisher
- Twine Growth
- Publication date
- 30 September 2026
- Research source
- The UK Franchise Growth Index
- Research population
- 817 networks
- Sample for this report
- 817 networks (every network in the Index)
- Data snapshot
- 22 September 2026
- Methodology
- Methodology for this report and the Index methodology
- Permanent link
- https://www.twinegrowth.com/uk-franchise-growth-index/reports/uk-franchise-growth-gap-report/
- Media enquiries
- Contact Twine Growth
Source: Twine Growth, the UK Franchise Growth Index
Journalist information
For media use
Journalists may cite aggregate findings from this report with attribution to Twine Growth and the UK Franchise Growth Index. Supporting cuts by industry or franchise characteristic should retain the denominator and methodological caveats shown in this report.
The proprietary master database is not published. The methodology and denominators in this report are provided so the aggregate findings can be understood and interpreted responsibly.
Preferred attribution
According to the UK Franchise Growth Gap Report, published by Twine Growth using data from the UK Franchise Growth Index.
Corrections and updates
- Published
- 30 September 2026
- Last updated
- 1 October 2026
- Version
- 1.0 (PDF version 1.0)
- Data snapshot
- 22 September 2026
No corrections have been issued for this edition.
If you represent a franchise network and something in this report is wrong or out of date, send us the evidence and we will review it. Corrections are recorded here, and the page address never changes.