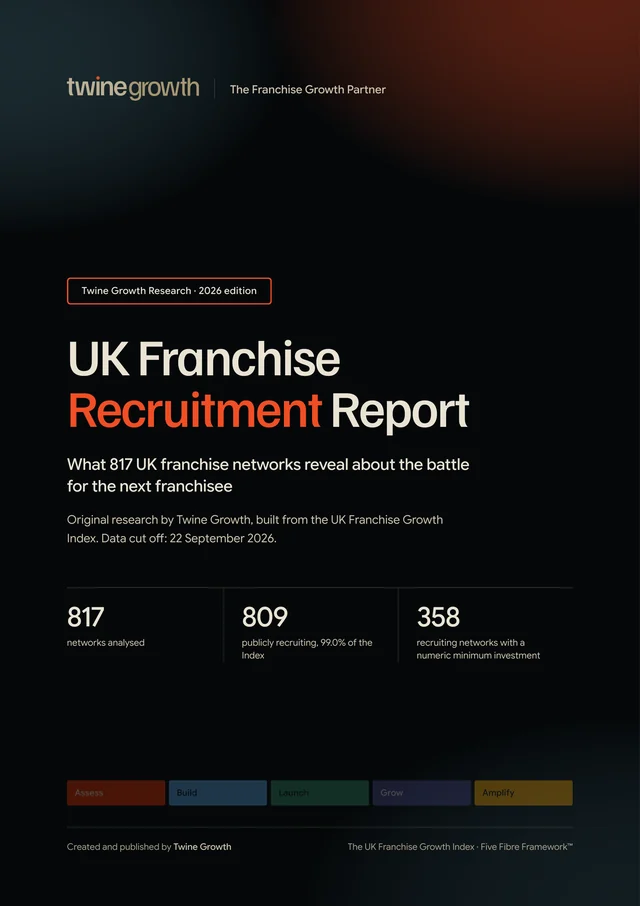
Executive summary
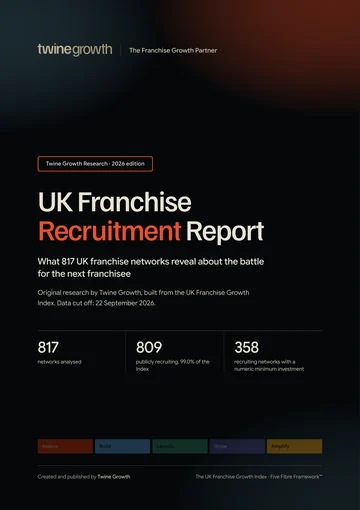
- Competition is almost universal within this dataset: 809 of 817 networks are publicly recorded as recruiting in some form.
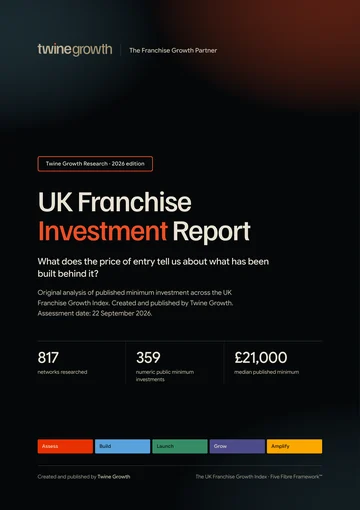
- Among the 358 publicly recruiting networks with a numeric minimum investment recorded, the median is £20,975 and the mean is £54,575.
- The average Grow score for publicly recruiting networks is 12.3/20, compared with 9.6/20 for the eight networks not publicly recorded as recruiting.
- Build is stronger than Grow in all 809 publicly recruiting networks in the Index. This is a structural pattern in the current assessment data, not proof that every network has completed its operating foundations.
- Amplify is stronger than Grow in 807 of 809 publicly recruiting networks. Grow exceeds Amplify in only 1.
- Only 358 of 809 publicly recruiting networks have a numeric minimum investment recorded in the Index, leaving 451 without a directly comparable numeric figure.
The battle for the next franchisee
You cannot grow a franchise network without franchisees. But wanting more franchisees and being ready to recruit them are two very different things.
Twine Growth analysed all 817 franchise networks in the UK Franchise Growth Index. The purpose is not to ask franchisors how recruitment feels. It is to measure what a prospective franchisee can actually discover in public, then connect that evidence to the wider growth foundations visible across each network.
The most striking finding is the scale of competition. 809 of 817 networks, or 99.0%, are publicly recorded as open to some form of franchise recruitment. Only 1 is recorded as resales only, while 7 have no publicly identifiable recruitment status in the Index.
Key findings
809 of the 817 UK franchise networks analysed by Twine Growth are publicly recorded as open to some form of franchise recruitment, equivalent to 99.0%.
Among the 358 publicly recruiting networks with a numeric minimum investment recorded, the median minimum investment is £20,975.
The mean minimum investment across those 358 recruiting networks is £54,575, above the median because higher capital opportunities pull the average upwards.
Only 358 of 809 publicly recruiting networks, 44.3%, have a directly comparable numeric minimum investment recorded in the Index.
Build scores above Grow in all 809 publicly recruiting networks in the current Index assessment.
Amplify scores above Grow in 807 of 809 publicly recruiting networks, or 99.8%.
More findings from the report
- 12.3/20The average Grow score among publicly recruiting networks is 12.3/20, compared with an average Build score of 16.5/20.
- 162Food and Drink contains 162 publicly recruiting networks, the largest absolute industry count in the Index.
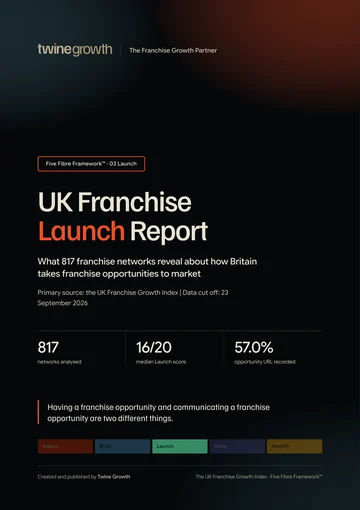
- 57.2%A dedicated franchise opportunity URL is identifiable for 463 of 809 publicly recruiting networks, or 57.2%.
- 40.0%An approximate franchisee count is publicly identifiable for 324 of 809 publicly recruiting networks, or 40.0%.
- 41.4%A franchising start year is identifiable for 335 of 809 publicly recruiting networks, or 41.4%.
- £12,500Home based opportunities have a median numeric minimum investment of £12,500, while retail premises opportunities have a median of £50,000.
Every finding is from Twine Growth’s analysis of the UK Franchise Growth Index. The base for each figure is stated in the finding itself.
UK franchise recruitment in numbers
The Index records 809 networks as publicly open to franchise recruitment in some form. That is 99.0% of the entire research population. Seven networks have a recruitment status that is not publicly stated or disclosed, and one is recorded as resales only.
Recruitment by industry
| Industry | Networks | Recruiting | Recruitment rate |
|---|---|---|---|
| Food and Drink | 163 | 162 | 99.4% |
| Childcare and Children’s Activities | 115 | 115 | 100.0% |
| Business Consultancy, Services and Support | 69 | 68 | 98.6% |
| Cleaning Services | 66 | 65 | 98.5% |
| Retail | 42 | 40 | 95.2% |
| Care | 36 | 36 | 100.0% |
| Education and Tuition | 36 | 36 | 100.0% |
| Fitness | 32 | 32 | 100.0% |
Food and Drink contains the largest absolute number of publicly recruiting networks in the Index, followed by Childcare and Children’s Activities and Business Consultancy, Services and Support. Because recruitment is nearly universal across the Index, absolute counts are more informative here than small differences in percentage rates.
Recruitment by franchise category
| Franchise category | Networks | Recruiting | Rate |
|---|---|---|---|
| Quick Service Franchise | 72 | 72 | 100.0% |
| Children’s Sports Franchise | 38 | 38 | 100.0% |
| Home Care Franchise | 33 | 33 | 100.0% |
| Children’s Creative Franchise | 31 | 31 | 100.0% |
| Specialist Cleaning Franchise | 27 | 27 | 100.0% |
| Consultancy Franchise | 26 | 25 | 96.2% |
| Dessert Franchise | 25 | 25 | 100.0% |
| Commercial Cleaning Franchise | 22 | 21 | 95.5% |
| Early Years Franchise | 21 | 21 | 100.0% |
| Store Franchise | 21 | 21 | 100.0% |
| Estate Agency Franchise | 20 | 20 | 100.0% |
| Fitness Club Franchise | 19 | 19 | 100.0% |
Quick Service Franchise is the largest recruitment category by count in the Index. Children’s Sports, Home Care, Children’s Creative, Specialist Cleaning and Consultancy franchises also create dense candidate choice. The practical implication is simple: a franchise proposition competes not only against direct commercial rivals, but against many different ways for the same person to invest their time and capital.
The investment battle
Numeric minimum investment is available for 358 of the 809 publicly recruiting networks. Within that comparable group, the median minimum investment is £20,975. The mean is £54,575, showing the influence of higher capital opportunities on the average.
| Minimum investment | Comparable networks | Recruiting | Recruitment rate |
|---|---|---|---|
| Under £10,000 | 89 | 89 | 100.0% |
| £10,000 to £24,999 | 102 | 102 | 100.0% |
| £25,000 to £49,999 | 75 | 75 | 100.0% |
| £50,000 to £99,999 | 35 | 34 | 97.1% |
| £100,000 to £249,999 | 40 | 40 | 100.0% |
| £250,000 plus | 18 | 18 | 100.0% |
The recruitment proposition
The Index shows a sharp difference between being visibly open to franchise enquiries and giving candidates comparable information before they enquire.
- Dedicated franchise opportunity URL: 463 of 809 publicly recruiting networks (57.2%).
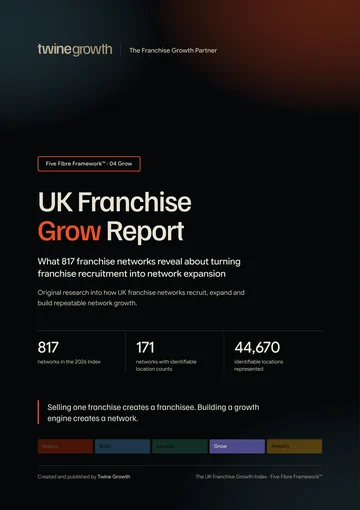
- Usable approximate location count: 170 of 809 publicly recruiting networks (21.0%). Most other records describe the network in words, such as “UK network”.
- Approximate franchisee count identifiable: 324 of 809 publicly recruiting networks (40.0%).
- Franchising start year identifiable: 335 of 809 publicly recruiting networks (41.4%).
- Numeric minimum investment recorded: 358 of 809 publicly recruiting networks (44.3%).
A dedicated franchise opportunity destination is identifiable for more than half of publicly recruiting networks. Comparable investment and network maturity information is less consistent. That creates friction for anyone trying to compare opportunities before speaking to a franchisor.
Franchise Recruitment Transparency
Transparency here means public identifiability within the Index, not the quality of information supplied later in a formal recruitment process. A missing public field does not prove that a franchisor withholds that information from qualified candidates.
The clearest gap is financial comparability. A numeric minimum investment is recorded for 358 publicly recruiting networks, leaving 451 without a directly comparable numeric minimum in the dataset.
Recruitment and network age
| Franchise maturity | Networks with known or unknown year | Recruiting | Recruitment rate | Average Grow |
|---|---|---|---|---|
| 0 to 5 years | 83 | 83 | 100.0% | 10.5 |
| 6 to 10 years | 51 | 51 | 100.0% | 12.5 |
| 11 to 20 years | 82 | 82 | 100.0% | 14.2 |
| More than 20 years | 120 | 119 | 99.2% | 14.4 |
| No public year | 481 | 474 | 98.5% | 11.7 |
Recruitment is close to universal across every maturity cohort, so the stronger signal is not whether networks recruit but how the publicly visible growth infrastructure changes with maturity. Average Grow scores rise across the known age cohorts, from younger networks towards longer established networks.
Recruitment and network size
| Approx franchisees | Networks with comparable size | Recruiting | Recruitment rate | Average Grow |
|---|---|---|---|---|
| 1 to 5 | 28 | 28 | 100.0% | 10.3 |
| 6 to 10 | 14 | 14 | 100.0% | 11.5 |
| 11 to 25 | 45 | 45 | 100.0% | 13.0 |
| 26 to 50 | 71 | 71 | 100.0% | 13.9 |
| 51 to 100 | 76 | 75 | 98.7% | 13.8 |
| 100 plus | 91 | 91 | 100.0% | 14.6 |
A numeric franchisee count could be extracted for 325 networks. Recruitment remains extremely common across every size band. Average Grow scores, however, rise overall from 10.3/20 among networks with 1 to 5 franchisees to 14.6/20 among those with more than 100.
This does not establish causation. Larger networks may have had more time, resource and evidence to make recruitment infrastructure publicly visible.
Home based, mobile and premises based
| Operating model | Networks | Recruiting | Rate | Median numeric minimum | Avg Grow |
|---|---|---|---|---|---|
| Home based: Yes | 436 | 432 | 99.1% | £12,500 | 11.9 |
| Home based: No | 381 | 377 | 99.0% | £50,000 | 12.7 |
| Mobile: Yes | 313 | 310 | 99.0% | £12,500 | 12.0 |
| Mobile: No | 504 | 499 | 99.0% | £35,000 | 12.5 |
| Retail premises: Yes | 350 | 348 | 99.4% | £50,000 | 12.8 |
| Retail premises: No | 467 | 461 | 98.7% | £12,500 | 11.9 |
The operating model changes the capital profile far more than it changes recruitment status. Home based and mobile opportunities have a median numeric minimum investment of £12,500, while retail premises opportunities have a median of £50,000.
The Five Fibre recruitment profile
Publicly recruiting networks score higher on average across all five Fibres than the small group not publicly recorded as recruiting. The comparison should be treated cautiously because that second group contains only eight networks.
| Fibre | Recruiting average | Not publicly recorded as recruiting |
|---|---|---|
| Assess | 16.5/20 | 15.3/20 |
| Build | 16.5/20 | 15.1/20 |
| Launch | 15.5/20 | 13.1/20 |
| Grow | 12.3/20 | 9.6/20 |
| Amplify | 14.6/20 | 11.8/20 |
The more important pattern sits inside the recruiting cohort itself: Assess and Build are strongest, Grow is weakest, and Amplify sits between them.
The Recruitment Readiness Gap
The report defines the Recruitment Readiness Gap as the visible distance between network recruitment activity and the surrounding infrastructure evidenced by the Five Fibre assessment. It is an analytical lens, not a new score.
Across 809 publicly recruiting networks, average Build is 16.5/20, average Grow is 12.3/20 and average Launch is 15.5/20.
Build is above Grow in all 809 publicly recruiting networks. Grow is above Build in 0. That makes the dominant pattern one of stronger visible operating foundations than visible recruitment performance.
Build before Grow
The current Index produces an unusually consistent result: every publicly recruiting network has a Build score above its Grow score. This is useful because it rejects one of the report’s starting hypotheses. The data does not show widespread public evidence of recruitment running ahead of Build.
Instead, the opportunity appears to sit in converting established propositions, systems and onboarding foundations into stronger, more measurable franchise recruitment infrastructure.
Grow versus Amplify
Amplify is above Grow in 807 of 809 publicly recruiting networks. The average Amplify score is 14.6/20 compared with 12.3/20 for Grow.
On the public evidence used by the Index, support for local franchisee growth is more visible than the systems used to attract and convert the next franchisee. That is the reverse of the hypothesis that recruitment would routinely outrun local franchisee growth support.
Recruitment by industry through the Five Fibres
| Industry | Networks | Avg Build | Avg Grow | Avg Amplify |
|---|---|---|---|---|
| Property Management | 13 | 17.3 | 13.3 | 15.7 |
| Estate and Letting Agents | 31 | 17.1 | 13.3 | 15.1 |
| Care | 36 | 16.8 | 13.1 | 14.9 |
| Retail | 42 | 17.4 | 13.0 | 15.4 |
| Childcare and Children’s Activities | 115 | 17.0 | 13.0 | 15.2 |
| Fitness | 32 | 16.8 | 12.9 | 15.0 |
| Cleaning Services | 66 | 16.9 | 12.6 | 14.7 |
| Maintenance, Building, Plumbing and Gardening | 29 | 16.7 | 12.6 | 14.6 |
| Pet Services | 18 | 16.6 | 12.4 | 14.8 |
| Holidays and Travel | 13 | 17.3 | 12.4 | 15.1 |
| Education and Tuition | 36 | 16.5 | 12.3 | 14.5 |
| Accountancy, Finance and Professional Services | 19 | 16.2 | 12.2 | 14.3 |
The table shows the twelve highest average Grow scores among the 20 industries with at least 10 networks, which avoids over interpreting tiny samples. It shows structural differences in publicly visible recruitment infrastructure while keeping the emphasis on evidence rather than declaring sector winners.
The candidate research journey
Before making an enquiry, a prospective franchisee can reasonably want answers to a small set of practical questions. The Index shows how often those answers are identifiable in public.
| Candidate question | Publicly identifiable | Relevant denominator | Share |
|---|---|---|---|
| What does the business do? | 817 | 817 | 100.0% |
| Is it recruiting? | 810 | 817 | 99.1% |
| What does it cost? Numeric minimum | 358 | 809 | 44.3% |
| How established is the franchise? Start year | 335 | 809 | 41.4% |
| How large is the network? Franchisee count | 324 | 809 | 40.0% |
| Where do I enquire? Opportunity URL | 463 | 809 | 57.2% |
The strongest public coverage is basic proposition and enquiry access. The weakest comparable information is the minimum investment, franchise start year and approximate franchisee count.
The Recruitment Information Gap
The Recruitment Information Gap is the distance between the basic facts a candidate needs to begin comparing an opportunity and the facts that can be identified publicly. It is measured field by field rather than reduced to an arbitrary composite score.
Franchisee count and start year are missing even more often, but the financial gap matters most in practice, because investment is one of the first practical filters available to a prospective franchisee, yet fewer than half of publicly recruiting networks have a numeric minimum investment recorded.
Franchise recruitment competition map
| Industry | <£10k | £10k to £24,999 | £25k to £49,999 | £50k to £99,999 | £100k to £249,999 | £250k+ |
|---|---|---|---|---|---|---|
| Food and Drink | 3 | 9 | 5 | 11 | 25 | 13 |
| Childcare and Children’s Activities | 33 | 14 | 3 | 1 | 1 | 2 |
| Business Consultancy, Services and Support | 6 | 7 | 9 | 1 | 0 | 0 |
| Cleaning Services | 10 | 19 | 2 | 1 | 0 | 0 |
| Retail | 1 | 4 | 2 | 3 | 3 | 1 |
| Care | 0 | 1 | 17 | 3 | 2 | 0 |
| Education and Tuition | 10 | 4 | 5 | 0 | 0 | 0 |
| Fitness | 0 | 2 | 2 | 4 | 3 | 1 |
This matrix shows where publicly recruiting opportunities with comparable numeric investment figures cluster. It is not a market share measure. It is a view of how many different franchise propositions may be competing for candidates with similar capital ranges.
What changes with network maturity?
| Maturity | Networks | Build | Launch | Grow | Amplify |
|---|---|---|---|---|---|
| 0 to 5 years | 83 | 15.5 | 15.0 | 10.5 | 13.6 |
| 6 to 10 years | 51 | 16.7 | 15.4 | 12.5 | 14.6 |
| 11 to 20 years | 82 | 17.8 | 16.6 | 14.2 | 16.0 |
| More than 20 years | 120 | 17.9 | 16.7 | 14.4 | 16.1 |
| No public year | 481 | 16.1 | 15.0 | 11.7 | 14.1 |
Among networks with an identifiable franchising start year, the public Five Fibre evidence generally strengthens with maturity. The largest data limitation is that 481 networks do not yield a comparable start year from the current field, so the maturity analysis should not be treated as a complete longitudinal picture of UK franchising.
What surprised us?
- Recruitment is almost universal in the Index: 99.0% of networks are publicly recorded as recruiting in some form.
- Only 44.3% of publicly recruiting networks have a numeric minimum investment recorded, despite investment being a basic comparison point for candidates.
- Build is above Grow in all 809 publicly recruiting networks. The data does not support the hypothesis that Grow commonly outruns Build.
- Amplify is above Grow in 99.8% of publicly recruiting networks, suggesting that local franchisee growth support is more visible than franchisee recruitment performance across the Index.
- Recruitment status itself varies little by age, size or operating model because almost every network is recruiting. The more useful differences appear in transparency, investment and Five Fibre strength.
- The median numeric minimum investment for home based opportunities is £12,500, compared with £50,000 for retail premises opportunities.
Methodology
Research population: all 817 franchise networks in the UK Franchise Growth Index.
Data cut off: 22 September 2026, based on the assessment and verification dates contained in the Index.
Recruitment definition: Active, Recruiting, Limited, Selective and Recruiting UK Area Developers are treated as publicly recruiting. Not publicly disclosed and Not publicly stated are treated as unknown. Resales only is treated as not recruiting new franchisees.
Investment: Median and mean investment figures use numeric values in Investment From only. Text values, POA, brand dependent figures, liquid capital statements and missing public figures are excluded rather than converted to zero.
Network age: A four digit franchising start year is extracted where the field contains a usable year. Networks without a comparable year remain visible as missing rather than being imputed.
Network size: Approximate franchisee counts are used only where a numeric value can be extracted from the public field. The result is an approximation and is not treated as an audited unit count.
Five Fibre: Assess, Build, Launch, Grow and Amplify scores are taken directly from the UK Franchise Growth Index. They reflect publicly visible evidence at the assessment date.
Public absence: A missing public record is not evidence that an internal process, document, financial figure or support mechanism does not exist.
Corrections: franchisors can submit factual updates, supported by public evidence, through the corrections route on the online report page.
Version: 1.0, September 2026.
This report uses the shared Index methodology, set out in full in how the UK Franchise Growth Index was created, plus the report-specific method above.
Research limitations
- The report measures public information, not confidential franchisor data.
- Publicly recruiting does not mean every territory is available or every candidate is accepted.
- The report does not measure lead volume, cost per lead, enquiry conversion, recruitment marketing spend or territory availability unless those facts are explicitly present in the Index.
- The very high recruitment rate means recruitment status is not a strong differentiator inside this dataset. Transparency, investment and Five Fibre evidence provide more useful separation.
- Five Fibre scores are assessments of public evidence and should not be treated as audits of internal capability.
- Network size and start year analyses use only comparable records and show their denominators.
- Correlation and pattern do not establish causation.
- This report does not recommend any individual franchise opportunity or assess the legal quality of franchise agreements.
For journalists
- Report
- UK Franchise Recruitment Report
- Publisher
- Twine Growth
- Publication date
- 30 September 2026
- Research source
- The UK Franchise Growth Index
- Research population
- 817 networks
- Sample for this report
- 809 publicly recruiting networks
- Data snapshot
- 22 September 2026
- Methodology
- Methodology for this report and the Index methodology
- Permanent link
- https://www.twinegrowth.com/uk-franchise-growth-index/reports/uk-franchise-recruitment-report/
- Media enquiries
- Contact Twine Growth
Source: Twine Growth, the UK Franchise Growth Index
Media story angles
The scale story: Almost the entire Index is publicly competing for franchisees.
The transparency story: Recruitment is visible far more often than directly comparable investment and network information.
The growth story: Build consistently scores above Grow, raising the question of how networks convert foundations into recruitment performance.
The franchisee support story: Amplify is stronger than Grow across almost the entire recruiting cohort.
The investment story: Candidate competition can be segmented by the capital required to enter each opportunity.
The sector story: Food and Drink, Children’s Activities and Business Services contain the largest pools of recruiting networks.
Journalist summary box
The online report page carries the full findings, the methodology link and the corrections route. Industry specific data cuts are available on request from info@twinegrowth.com.
Corrections and updates
- Published
- 30 September 2026
- Last updated
- 1 October 2026
- Version
- 1.0 (PDF version 1.0)
- Data snapshot
- 22 September 2026
No corrections have been issued for this edition.
If you represent a franchise network and something in this report is wrong or out of date, send us the evidence and we will review it. Corrections are recorded here, and the page address never changes.