Executive summary
- Investment information was numerically identifiable for 359 of 817 networks, or 43.9%. For 458 networks, or 56.1%, the Index did not record a minimum investment as a plain number.
- 209 of 359 networks with a known figure, 58.2%, sit at £25,000 or below. 311, or 86.6%, sit at £100,000 or below.
- Home based networks have a median published minimum of £12,500, compared with £50,000 among networks recorded as not home based.
- Premises based networks have a median of £50,000, 4.0 times the £12,500 median among networks recorded as not requiring retail premises.
- The relationship between investment and overall Five Fibre score is positive but weak. Spearman correlation is 0.11. Paying more does not reliably predict stronger publicly evidenced growth foundations.
- The £250,000 plus band records the strongest average overall Five Fibre score at 85.2/100, but it contains only 18 networks and should be read as a small sample.
- The average Growth Gap narrows from 2.62 points below £10,000 to 2.21 points at £250,000 plus. The difference exists, but it does not remove the wider gap between growth foundations and growth execution.
What this report measures
The advertised investment figure is one of the first numbers a prospective franchisee sees. On its own, it says very little about the structure behind the opportunity. This report examines the financial entry point and then connects it with market structure, operating model and the Five Fibre Framework™.
Investment is a price. Growth infrastructure is evidence.
The analysis keeps those two ideas separate and tests whether they move together.
- The report uses public information recorded in the UK Franchise Growth Index. It does not use confidential franchise agreements, private funding arrangements, actual franchisee expenditure or undisclosed working capital.
- A published minimum investment is not treated as a promise of total capital required, profitability, earnings, franchisee satisfaction or investment quality.
- Missing public investment information is retained as missing. It is never estimated.
Key findings
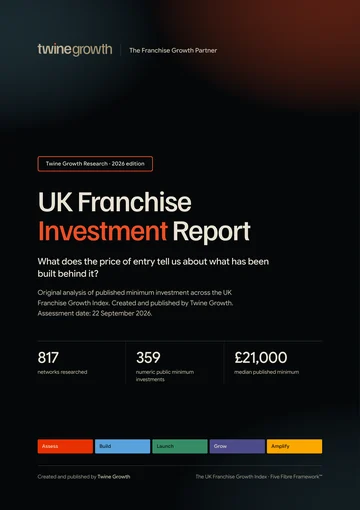
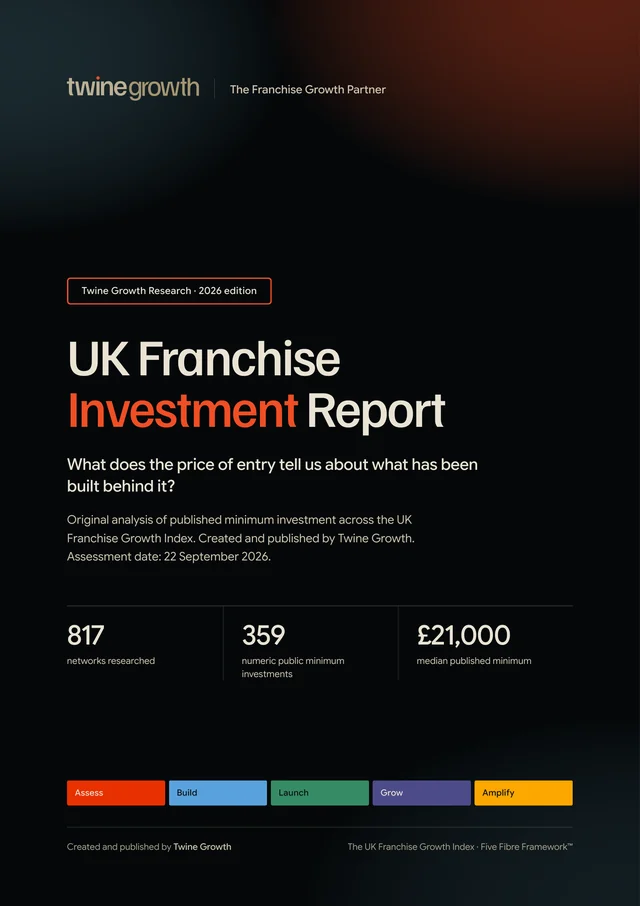
Of 817 franchise networks in the UK Franchise Growth Index, 359, or 43.9%, had a numeric public minimum investment captured in the Index.
The median published minimum investment across those 359 networks is £21,000; the mean is £54,562.
The middle 50% of known minimum investments runs from £10,000 to £50,000.
96 of 359, or 26.7%, have a published minimum of £10,000 or below.
209 of 359, or 58.2%, have a published minimum of £25,000 or below.
280 of 359, or 78.0%, have a published minimum of £50,000 or below.
More findings from the report
- 86.6%311 of 359, or 86.6%, have a published minimum of £100,000 or below.
- £12,500Home based networks with known investment have a median of £12,500.
- £50,000Retail premises based networks with known investment have a median of £50,000.
- £100,000Food and Drink has a £100,000 median across 66 networks with known investment.
- £8,998Childcare and Children’s Activities has an £8,998 median across 54 networks with known investment.
- 0.11The Spearman correlation between minimum investment and overall Five Fibre score is 0.11.
- 85.2/100The £250,000 plus band averages 85.2/100 overall across 18 networks.
- 2.62The average Growth Gap narrows from 2.62 points below £10,000 to 2.21 points at £250,000 plus.
Every finding is from Twine Growth’s analysis of the UK Franchise Growth Index. The base for each figure is stated in the finding itself.
The investment universe
The transparency rate matters because any market wide investment statistic is only as representative as the information available. For that reason, every investment calculation in this report uses the relevant eligible sample rather than the full Index by default.
The price of entry
| Measure | Result |
|---|---|
| Networks with numeric minimum | 359 |
| Median | £21,000 |
| Mean | £54,562 |
| 25th percentile | £10,000 |
| 75th percentile | £50,000 |
| Lowest recorded numeric minimum | £0 |
| Highest recorded numeric minimum | £1,800,000 |
The median is the more useful central measure here. The mean is more than twice as high because a relatively small number of high investment opportunities pull it upwards. The middle half of known figures runs from roughly £10,000 to £50,000.
Two records carry a numeric minimum of £0 in the source data. They remain in the analysis because the report does not replace recorded public figures with assumptions. They should be read as recorded entry figures, not as evidence that operating the business requires no capital.
Investment is concentrated below £50,000
| Investment band | Networks | Share of known |
|---|---|---|
| Under £10k | 89 | 24.8% |
| £10k to £24,999 | 102 | 28.4% |
| £25k to £49,999 | 75 | 20.9% |
| £50k to £99,999 | 35 | 9.7% |
| £100k to £249,999 | 40 | 11.1% |
| £250k plus | 18 | 5.0% |
The two bands below £25,000 contain 191 networks. The two highest bands, £100,000 and above, contain 58 networks. The distribution is therefore weighted towards lower published entry points even though the mean is pulled upwards by the upper tail.
How choice expands with available capital
| Published minimum at or below | Networks | Share of known |
|---|---|---|
| £10,000 | 96 | 26.7% |
| £25,000 | 209 | 58.2% |
| £50,000 | 280 | 78.0% |
| £100,000 | 311 | 86.6% |
This describes published minimum investment only. It does not establish that a buyer with £25,000 could necessarily fund, qualify for or successfully operate every opportunity in that group.
Industry and operating model
Industry changes the investment picture
| Industry | Known n | Median |
|---|---|---|
| Food and Drink | 66 | £100,000 |
| Fitness | 12 | £85,500 |
| Retail | 15 | £50,000 |
| Property Management | 7 | £45,000 |
| Care | 23 | £35,000 |
| Accountancy, Finance and Professional Services | 7 | £25,000 |
| Estate and Letting Agents | 12 | £21,250 |
| Automotive | 12 | £20,000 |
Food and Drink has the highest median among the larger industry samples at £100,000 across 66 networks. Childcare and Children’s Activities sits at £8,998 across 54 networks, while Cleaning Services sits at £14,968 across 32. These are differences in the opportunities represented in the Index, not universal sector prices.
Operating model matters
| Operating model | Known n | Median |
|---|---|---|
| Home based | 195 | £12,500 |
| Mobile | 144 | £12,500 |
| Premises based | 152 | £50,000 |
| Management | 229 | £35,000 |
| Executive | 238 | £35,000 |
The clearest structural differences are premises and home based working. Networks recorded as retail premises based have a £50,000 median, compared with £12,500 among those recorded as not premises based. Home based and mobile models both sit at £12,500 median minimum investment, against £50,000 for networks recorded as not home based.
The premises premium
£50,000 versus £12,500 among networks recorded as not requiring retail premises, using 152 and 207 networks respectively. This is consistent with the practical reality that premises can introduce fit out, equipment and property related costs. The Index does not contain a standardised cost breakdown for every network, so this report does not attribute the entire difference to any single component.
Maturity, scale and recruitment
Does network maturity change the price?
| Years franchising | Known n | Median |
|---|---|---|
| 0 to 5 years | 38 | £27,475 |
| 6 to 10 years | 34 | £24,998 |
| 11 to 20 years | 62 | £19,975 |
| 21 to 40 years | 77 | £23,500 |
| 41 plus years | 14 | £40,000 |
The medians do not rise in a straight line with network age. Networks franchising for 0 to 5 years have a £27,475 median, compared with £19,975 for 11 to 20 years and £40,000 for 41 plus years. The oldest group is small, so the result should not be treated as evidence that age causes a higher entry price.
Does network size change the price?
| Approx franchisees | Known n | Median |
|---|---|---|
| 0 to 9 | 23 | £12,995 |
| 10 to 24 | 23 | £25,000 |
| 25 to 49 | 37 | £20,000 |
| 50 to 99 | 49 | £20,950 |
| 100 to 249 | 44 | £28,500 |
| 250 plus | 24 | £30,000 |
Larger network size is associated with a higher median at the upper end of this cut, but the pattern is not monotonic. Networks with 250 plus approximate franchisees have a £30,000 median. This analysis uses approximate public counts and should be read as directional.
Recruitment competition by price
| Investment band | Actively recruiting networks | Share of active known |
|---|---|---|
| Under £10k | 89 | 25.1% |
| £10k to £24,999 | 102 | 28.7% |
| £25k to £49,999 | 75 | 21.1% |
| £50k to £99,999 | 34 | 9.6% |
| £100k to £249,999 | 40 | 11.3% |
| £250k plus | 15 | 4.2% |
The densest competition sits below £25,000. For franchisors, the commercial point is not that one band is better. It is that a prospective franchisee comparing opportunities at a given capital level may face a much wider competitive set than a single franchisor sees from inside its own category.
Investment and the Five Fibre Framework™
Does paying more correspond with stronger foundations?
| Measure | Spearman correlation with investment |
|---|---|
| Assess | 0.09 |
| Build | 0.07 |
| Launch | 0.13 |
| Grow | 0.14 |
| Amplify | 0.08 |
| Overall Five Fibre | 0.11 |
All relationships are positive, but all are weak. Grow has the strongest relationship at 0.14. Overall Five Fibre score is 0.11. The data therefore does not support a simple claim that a higher price reliably buys stronger publicly evidenced franchise growth foundations.
The premium band is stronger, but price is not a proxy
| Investment band | n | Average overall | Median overall |
|---|---|---|---|
| Under £10k | 89 | 75.8 | 78.0 |
| £10k to £24,999 | 102 | 77.1 | 78.0 |
| £25k to £49,999 | 75 | 76.9 | 80.0 |
| £50k to £99,999 | 35 | 73.6 | 78.0 |
| £100k to £249,999 | 40 | 78.0 | 79.0 |
| £250k plus | 18 | 85.2 | 90.0 |
The £250,000 plus group stands out with an average overall score of 85.2 and a median of 90. Yet the middle bands do not rise consistently with price. The £50,000 to £99,999 group averages 73.6, below the £25,000 to £49,999 group at 76.9. That uneven pattern is why correlation remains weak.
Positive does not mean predictive, and correlation does not establish causation.
Investment and the Growth Gap
The Growth Gap does not narrow steadily as investment rises. It is widest in the £50,000 to £99,999 band at 2.64 points, against 2.62 points below £10,000, and narrows clearly only above £100,000, to 2.21 points at £250,000 plus. The movement is modest. Higher investment is associated with a somewhat more balanced public profile, but the gap remains present in every band.
| Investment band | Average Growth Gap | Average fibre spread |
|---|---|---|
| Under £10k | 2.62 | 4.33 |
| £10k to £24,999 | 2.57 | 4.13 |
| £25k to £49,999 | 2.55 | 4.07 |
| £50k to £99,999 | 2.64 | 4.20 |
| £100k to £249,999 | 2.36 | 3.78 |
| £250k plus | 2.21 | 3.61 |
Investment transparency
Investment transparency is itself a finding
| Industry | Index networks | Known investment | Transparency rate |
|---|---|---|---|
| Care | 36 | 23 | 63.9% |
| Home Improvement and Renovations | 30 | 19 | 63.3% |
| Education and Tuition | 36 | 19 | 52.8% |
| Cleaning Services | 66 | 32 | 48.5% |
| Childcare and Children’s Activities | 115 | 54 | 47.0% |
| Maintenance, Building, Plumbing and Gardening | 29 | 13 | 44.8% |
| Automotive | 28 | 12 | 42.9% |
| Food and Drink | 163 | 66 | 40.5% |
| Estate and Letting Agents | 31 | 12 | 38.7% |
| Fitness | 32 | 12 | 37.5% |
| Retail | 42 | 15 | 35.7% |
| Business Consultancy, Services and Support | 69 | 23 | 33.3% |
Among industries with at least 20 networks in the Index, Care and Home Improvement and Renovations have the highest numeric disclosure rates at 63.9% and 63.3% respectively. Business Consultancy, Services and Support is lowest in this cut at 33.3%. This says only whether a reliable numeric figure was captured publicly, not why it was or was not published.
Transparency and Five Fibre scores
This is an association between two forms of public evidence. It should not be interpreted as proof that publishing a price improves a franchise network. A network that communicates more information publicly may simply make more of its wider systems visible to an external assessment.
Findings and media facts
What surprised us
- The median published minimum is £21,000, while the mean is £54,562. One headline average therefore gives a distorted picture of the typical recorded entry point.
- More than half of networks with known investment, 209 of 359, sit at £25,000 or below.
- Premises status creates one of the clearest investment differences in the dataset: £50,000 median versus £12,500 without retail premises.
- Higher investment does not map neatly to stronger Five Fibre scores. The overall rank correlation is only 0.11.
- The highest investment band has a stronger Five Fibre profile, but the middle bands move up and down rather than following a simple price ladder.
- The Growth Gap narrows by only 0.40 points between the lowest and highest investment bands.
- Investment transparency is incomplete: 56.1% of the Index lacks a plain numeric public minimum in the source field.
Publication integrity
Originality and external context
Existing UK franchise content already covers average costs, sector costs and the general difference between home based and premises based opportunities. Twine Growth therefore does not claim novelty for those generic observations.
- Franchise Hunt publishes an investment index based on its own directory and reports a median minimum investment.
- FindMyFranchise publishes investment figures by industry across opportunities in its directory.
- Quality Franchise Association and other franchise publications discuss typical setup costs and the components of franchise investment.
- The distinctive analysis in this report is the connection between investment, 817 individually researched networks, Five Fibre public evidence scores, the Growth Gap and investment transparency within the UK Franchise Growth Index.
- No claim of “first”, “only” or “largest” is made.
Methodology
Methodology and framework
- Population: all 817 networks in the UK Franchise Growth Index.
- Investment measure: the value recorded as a plain number in the Investment From field. Values written with a £ sign or added words, such as “£13,100 plus VAT”, are not read. Text entries such as Not publicly disclosed, Not publicly stated and Not publicly listed are treated as unavailable, not zero.
- Ranges: where the source database records a range, this report uses the Investment From value as the published minimum entry point.
- Currency: analysis uses numeric values recorded in the Index as GBP. No external currency conversion has been applied in this report.
- VAT and working capital: the database does not provide a standardised basis across every network. The report therefore does not claim that all figures include the same components.
- Five Fibre analysis: investment is compared with Assess, Build, Launch, Grow and Amplify scores already recorded in the Index.
- Growth Gap: calculated as the average of Assess, Build and Launch minus the average of Grow and Amplify for each network.
- Correlation: Spearman rank correlation is used because investment is highly skewed and the relationship need not be linear.
- Missing values: never estimated. Each calculation uses the eligible sample stated.
- Assessment date: the underlying Five Fibre assessments are dated 22 September 2026 in the Index.
- Active recruitment: “actively recruiting” means a recorded status of Active or Recruiting. Selective, Limited and Resales only are counted separately, so this report’s active count (355 of 359) is narrower than the UK Franchise Industry Intelligence Report’s.
- Sensitivity: reading figures written with a £ sign or added words would add 89 values (448 in all) and move the median minimum investment from £21,000 to £20,000. The headline picture does not change.
The Five Fibre Framework™
Readiness, positioning and market fit, measured before anything is built.
The systems, brand and operations a franchisee can actually follow.
Testing, onboarding and support that make the first successes repeatable.
Commercial growth, lead quality and conversion, scaled the right way.
Local marketing and support so every franchisee grows, not just the network.
The framework is used here as a public evidence lens. It is not a financial return model and does not rate investment quality.
This report uses the shared Index methodology, set out in full in how the UK Franchise Growth Index was created, plus the report-specific method above.
Research limitations
- Published minimum investment can change after the assessment date.
- A minimum investment may not equal the complete capital required to open and operate a franchise.
- Working capital, property, borrowing, deposits, VAT, equipment and personal living costs may be treated differently by different franchisors.
- The Index records public evidence. Private systems or internal performance data may produce a different picture.
- Approximate franchisee and location counts are used only where the Index contains them and should be treated as directional.
- The report does not recommend or endorse individual franchise opportunities and is not investment advice.
- Higher investment or a higher Five Fibre score must not be interpreted as evidence of higher earnings, profitability, satisfaction or financial return.
For journalists
- Report
- UK Franchise Investment Report
- Publisher
- Twine Growth
- Publication date
- 30 September 2026
- Research source
- The UK Franchise Growth Index
- Research population
- 817 networks
- Sample for this report
- 359 networks with a minimum investment recorded as a plain number
- Data snapshot
- 22 September 2026
- Methodology
- Methodology for this report and the Index methodology
- Permanent link
- https://www.twinegrowth.com/uk-franchise-growth-index/reports/uk-franchise-investment-report/
- Media enquiries
- Contact Twine Growth
Source: Twine Growth, the UK Franchise Growth Index
Journalist summary
For publication, link the report page to the live Index and the Index methodology page. Twine Growth can also provide aggregate industry, category and investment band cuts where the underlying sample is sufficient.
Corrections and updates
- Published
- 30 September 2026
- Last updated
- 1 October 2026
- Version
- 1.0 (PDF version 1.0)
- Data snapshot
- 22 September 2026
No corrections have been issued for this edition.
If you represent a franchise network and something in this report is wrong or out of date, send us the evidence and we will review it. Corrections are recorded here, and the page address never changes.