Executive summary
Five findings stand out. Food and Drink alone accounts for 163 of 817 networks, or 20.0%. The ten largest franchise categories account for 316 networks, or 38.7%, leaving a substantial long tail of specialist concepts.
Among the 359 networks with a numeric minimum investment recorded, 191 sit below £25,000. That is 53.2% of the known investment sample.
Public franchise start years are available for 255 networks. Of those, 66 began franchising from 2020 onwards, representing 25.9% of the known year sample.
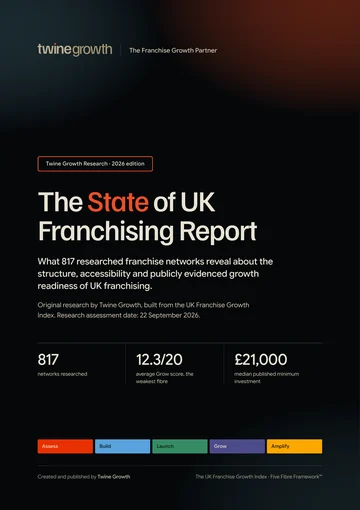
The Five Fibre profile is uneven. Assess averages 16.5, Build 16.5, Launch 15.5, Grow 12.3 and Amplify 14.6 out of 20. Grow is the lowest publicly evidenced Fibre.
What this report measures
The intelligence layer underneath the UK Franchise Growth Index
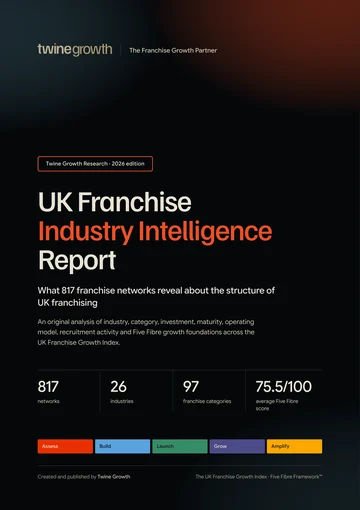
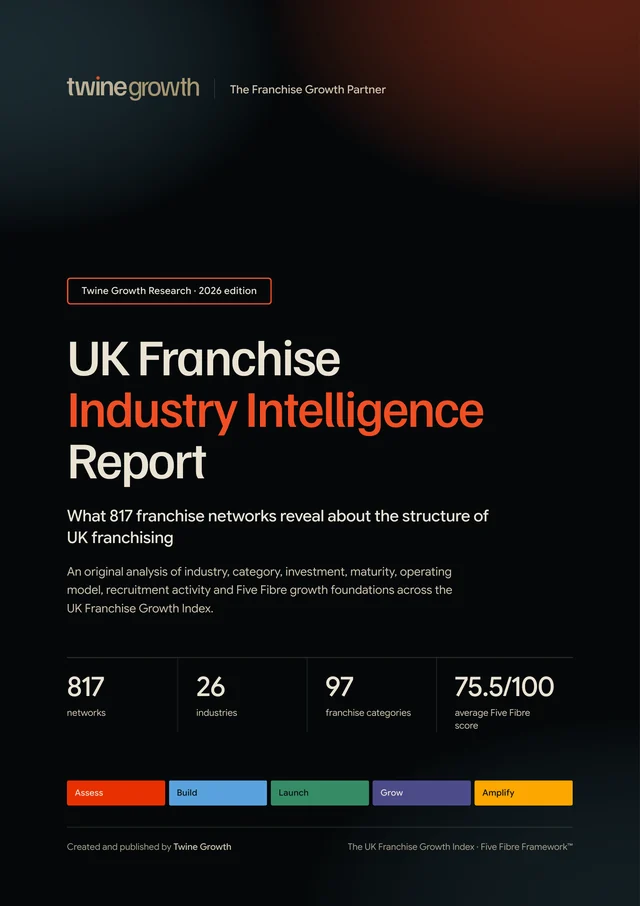
The UK Franchise Growth Index covers 817 franchise networks operating across the UK. But UK franchising is not one market. It is hundreds of different business models competing for customers, franchisees, territories and growth.
This report analyses the individual networks that make up that landscape. It examines industry, category, investment, maturity, operating model, recruitment activity and the Five Fibre growth foundations recorded in the UK Franchise Growth Index.
The principal findings in this report are newly calculated from the UK Franchise Growth Index dataset. External industry figures are used only as context.
Key findings
Analysis by Twine Growth of the UK Franchise Growth Index found 163 of 817 franchise networks sit within Food and Drink, representing 20.0% of the Index.
The Index contains 97 franchise categories. The ten largest account for 316 of 817 networks, or 38.7%.
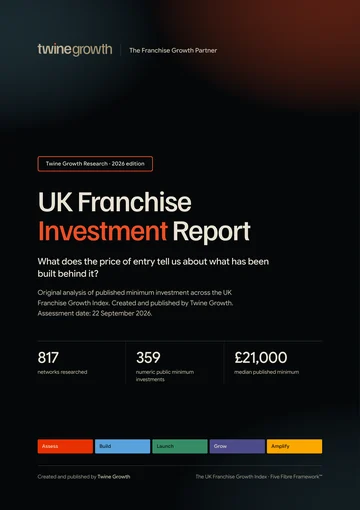
Among 359 franchise networks with a numeric minimum investment publicly recorded, the median minimum investment is £21,000.
Among those 359 networks, 191 sit below £25,000, representing 53.2% of the known investment sample.
A numeric franchise start year is available for 255 of 817 networks. Within that known sample, 66 began franchising from 2020 onwards, or 25.9%.
436 of 817 networks in the Index are classified as home based, equivalent to 53.4%.
More findings from the report
- 38.3%313 of 817 networks are classified as mobile, equivalent to 38.3%.
- 42.8%350 of 817 networks are classified as requiring or using retail premises, equivalent to 42.8%.
- 12.3/20Across all 817 Five Fibre assessments, Grow averages 12.3 out of 20, lower than Assess at 16.5, Build at 16.5, Launch at 15.5 and Amplify at 14.6.
- 75.5/100The overall Five Fibre score averages 75.5 out of 100 across all 817 networks.
- 25 of 817Only 25 of 817 networks give a franchisee or location count as a plain number, and 459 give no number at all, highlighting a significant public information gap.
- 99.1%810 of 817 networks are publicly coded as some form of active franchise recruitment, equivalent to 99.1%.
Every finding is from Twine Growth’s analysis of the UK Franchise Growth Index. The base for each figure is stated in the finding itself.
Mapping UK franchising
The Index contains 26 industries. Food and Drink is the largest with 163 networks. Childcare and Children’s Activities follows with 115, then Business Consultancy, Services and Support with 69.
The five largest industries contain 455 of 817 networks, or 55.7%. That concentration is meaningful, but it still leaves 362 networks spread across another 21 industries.
Go beneath the industry labels
The Index contains 97 franchise categories. Quick Service Franchise is the largest with 72 networks, followed by Children’s Sports Franchise with 38 and Home Care Franchise with 33.
The ten largest categories account for 316 of 817 networks, or 38.7%. In other words, most of the Index sits outside the ten largest categories.
The Franchise Long Tail
A large share of franchise categories contain only a small number of networks
Of the 97 categories in the Index, 20 contain a single network and another 35 contain between two and five. Only 1 category contains more than 50 networks.
This is an important structural point. UK franchising contains several large, familiar categories, but it also contains a wide tail of specialist propositions. Network count alone can hide that fragmentation.
When today’s networks began franchising
A public franchise start year is recorded numerically for 255 of 817 networks. The median start year within that known sample is 2010, equivalent to a median franchise age of 16 years in 2026.
Within the known year sample, 66 networks began franchising from 2020 onwards. That is 25.9%. Another 38 began between 2015 and 2019.
The post 2020 franchise generation
| Leading industries | Networks | Leading categories | Networks |
|---|---|---|---|
| Food and Drink | 25 | Quick Service Franchise | 14 |
| Business Consultancy, Services and Support | 6 | Children’s Sports Franchise | 4 |
| Childcare and Children’s Activities | 6 | Restaurant Franchise | 4 |
| Health and Wellbeing | 6 | Wellness Franchise | 4 |
| Home Improvement and Renovations | 4 | Consultancy Franchise | 3 |
| Care | 3 | Home Care Franchise | 3 |
Food and Drink contributes 25 of the 66 networks in the known post 2020 cohort. Quick Service Franchise is the most common category within that cohort with 14 networks.
These figures show where newer franchise concepts in the current Index are concentrated. They do not, on their own, establish why those categories attracted new franchisors.
The investment structure of UK franchising
Minimum investment is numeric for 359 of 817 networks. The distribution is broad, which is why the median of £21,000 is more representative of the centre than the mean of £54,562.
How much of the known market sits below key capital thresholds?
Investment requirement alone does not make a franchise financially accessible, suitable or lower risk. These figures simply show how the publicly recorded minimum investment sample is distributed.
The operating model mix
These classifications are not mutually exclusive. A franchise can, for example, be both home based and mobile, or both management and executive. The figures therefore describe characteristics of propositions rather than exclusive market segments.
Network size intelligence
The Index can support individual network research, but the current public record is not sufficiently standardised to build a reliable national network size distribution without a dedicated verification exercise.
Recruitment pressure is almost universal
Because recruitment is so widespread in the Index, recruitment status alone does not separate industries meaningfully. The more useful intelligence comes from investment, proposition transparency and the strength of the Five Fibre growth foundations surrounding that recruitment.
The Five Fibre industry profile
Across all 817 assessed networks, Assess averages 16.5, Build 16.5, Launch 15.5, Grow 12.3 and Amplify 14.6 out of 20.
The overall average is 75.5 out of 100. Grow sits 4.2 points below Build on the 20 point scale, making it the least visible Fibre in the public evidence assessed.
The Franchise Growth Infrastructure Curve
Within the 255 networks that have a usable franchise start year, average Five Fibre scores rise across the maturity cohorts. The strongest change is visible in Grow, from 9.7 among networks aged up to five years to 14.3 among networks aged 21 years or more.
Assess, Build, Launch and Amplify also rise across the maturity cohorts. This is an association within the current dataset, not evidence that age itself causes stronger infrastructure.
Industry intelligence cards
Concentration versus fragmentation
| Industry | Networks | Categories | Largest category share | Top three share |
|---|---|---|---|---|
| Food and Drink | 163 | 10 | 44% | 69% |
| Business Consultancy, Services and Support | 69 | 9 | 38% | 72% |
| Home Improvement and Renovations | 30 | 7 | 27% | 70% |
| Childcare and Children’s Activities | 115 | 6 | 33% | 78% |
| Automotive | 28 | 6 | 36% | 71% |
| Retail | 42 | 5 | 50% | 95% |
| Health and Wellbeing | 14 | 5 | 36% | 79% |
| Education and Tuition | 36 | 4 | 36% | 97% |
| Fitness | 32 | 4 | 59% | 91% |
| Maintenance, Building, Plumbing and Gardening | 29 | 4 | 48% | 97% |
| Pet Services | 18 | 4 | 72% | 94% |
| Property Management | 13 | 4 | 46% | 92% |
This view, covering the industries with four or more categories, separates market size from market shape. An industry can contain many networks but still be concentrated in a small number of categories, while another can contain fewer networks spread across a wider mix of propositions.
The public information economy
The contrast is stark. Recruitment status is almost always identifiable and a franchise opportunity URL is recorded for most networks, while numeric investment and maturity data are much less complete. Network size given as a plain number is particularly scarce in the current fields.
What surprised us
Only 38.7% of the Index sits inside the ten largest franchise categories.
316 of 817 networks are in the ten largest categories, leaving most of the Index in the wider category long tail.
53.2% of the known investment sample sits below £25,000.
That is 191 of 359 networks with a numeric minimum investment.
Grow is the weakest publicly evidenced Fibre.
Its average score is 12.3 out of 20, compared with 16.5 for Build.
Recruitment is almost universal in the Index.
810 of 817 networks are coded as active, recruiting, selective, limited, resales only or UK area developer recruitment.
Network size is one of the least standardised public data points.
Only 25 of 817 networks give a franchisee or location count as a plain number, and 459 give no number at all.
Ten things the Index tells us
- 01The UK Franchise Growth Index contains 817 franchise networks across 26 industries.
- 02Food and Drink accounts for 163 of 817 networks, or 20.0%.
- 03The Index contains 97 franchise categories and 209 recorded sub industries.
- 04The ten largest categories contain 316 of 817 networks, or 38.7%.
- 05A numeric franchise start year is available for 255 of 817 networks, with a median start year of 2010.
- 06Among those 255 networks, 66 began franchising from 2020 onwards, or 25.9%.
- 07A numeric minimum investment is available for 359 of 817 networks, with a median of £21,000.
- 08Within the known investment sample, 266 of 359 networks, or 74.1%, sit below £50,000.
- 09436 of 817 networks, or 53.4%, are classified as home based.
- 10The average overall Five Fibre score is 75.5 out of 100 across all 817 assessed networks.
Methodology
Research population: all 817 networks in the UK Franchise Growth Index.
Data cut off: 22 September 2026. The Index contains network by network public research, assessment dates and research source fields.
Classification: Each record is classified by Industry, Franchise Category and Sub Industry. This report treats Sub Industry as the most granular category layer available in the workbook.
Franchise maturity: Franchise start year uses only values recorded as a plain year from 1900 to 2026, such as 2015. Values with added text, such as “2008 in UK”, are excluded, which is why this report works from 255 start years. Text values such as Not Publicly Disclosed are excluded from age calculations.
Investment: Minimum investment uses only values recorded as plain numbers in Investment From, which gives 359 values. Missing values and values with added text or symbols, such as “£25,000” or “POA”, are excluded, never converted to zero. Thresholds and medians therefore use the known numeric sample only.
Network size: Numeric Approx Franchisees is used first. Numeric Approx Locations is used only where a franchisee count is not numeric. Text descriptions such as UK network, and years such as “in 2024”, are excluded. The plain number count (25) takes only bare numbers; the usable counts (325 franchisee and 171 location counts) also read values such as “60 plus” or “Approx 100”.
Recruitment status: Active recruitment includes records coded Active, Recruiting, Selective, Limited, Resales only or Recruiting UK Area Developers. Other or unclear statuses remain outside that active count.
Operating model: Home Based, Mobile, Retail Premises, Management Franchise and Executive Franchise are treated as independent yes or no characteristics. They are not mutually exclusive.
Five Fibre scoring: Assess, Build, Launch, Grow and Amplify are taken directly from the Index. Each Fibre is scored out of 20, producing an overall score out of 100.
Public evidence: The Index records public evidence available at the time of assessment. No Public Record Available and equivalent wording mean the information was not identified publicly, not that the information does not exist internally.
Conflicting sources: The underlying Index research uses official franchise material and other public sources. Where public evidence conflicts, the most direct and current source should be preferred and the record reviewed.
Corrections: The Index is designed as a living research asset. Network information, investment, recruitment status and public evidence can change, so corrections and periodic reverification should be built into publication governance.
This report uses the shared Index methodology, set out in full in how the UK Franchise Growth Index was created, plus the report-specific method above.
Research limitations
- The Index is a researched database, not a statutory register of every franchise operating in Britain.
- Public information changes. Network size, investment, recruitment status and leadership information can move after the assessment date.
- Missing public information is not evidence that the information does not exist internally.
- Franchise start year is not necessarily the same as company incorporation year.
- Network count does not measure revenue, employment or economic contribution.
- Industry network count does not measure the economic size of that industry.
- Five Fibre scores measure publicly identifiable evidence according to Twine Growth’s assessment methodology.
- Relationships between age, size, investment and Five Fibre scores are associations within the dataset. They should not be described as causal.
- The current network size fields are too thin and too inconsistent for robust market wide size conclusions.
- Minimum investment and franchise start year figures describe only the networks with a value recorded as a plain number.
- This report does not recommend individual franchise opportunities.
For journalists
- Report
- UK Franchise Industry Intelligence Report
- Publisher
- Twine Growth
- Publication date
- 30 September 2026
- Research source
- The UK Franchise Growth Index
- Research population
- 817 networks
- Sample for this report
- 817 networks across 26 industries and 97 categories
- Data snapshot
- 22 September 2026
- Methodology
- Methodology for this report and the Index methodology
- Permanent link
- https://www.twinegrowth.com/uk-franchise-growth-index/reports/uk-franchise-industry-intelligence-report/
- Media enquiries
- Contact Twine Growth
Source: Twine Growth, the UK Franchise Growth Index
The structure story
What 817 individual franchise networks reveal about the composition of UK franchising.
The long tail story
Why most of the Index sits outside the ten largest franchise categories.
The capital story
Why the median minimum investment is £21,000 among the 359 networks with numeric data, and how opportunities distribute across capital bands.
The newer network story
Where the 66 networks with known franchise start years from 2020 onwards are concentrated.
The operating model story
How home based, mobile and retail premises models overlap across the 817 networks.
The growth infrastructure story
Why Grow is the lowest publicly evidenced Fibre and how the Five Fibre profile changes across maturity cohorts.
The transparency story
Why investment and franchise start year are far easier to quantify than network size, and what that says about the public information environment.
Corrections and updates
- Published
- 30 September 2026
- Last updated
- 1 October 2026
- Version
- 1.0 (PDF version 1.0)
- Data snapshot
- 22 September 2026
No corrections have been issued for this edition.
If you represent a franchise network and something in this report is wrong or out of date, send us the evidence and we will review it. Corrections are recorded here, and the page address never changes.