Executive summary
This report asks one specific question: where are the businesses behind Britain’s franchise networks actually based?
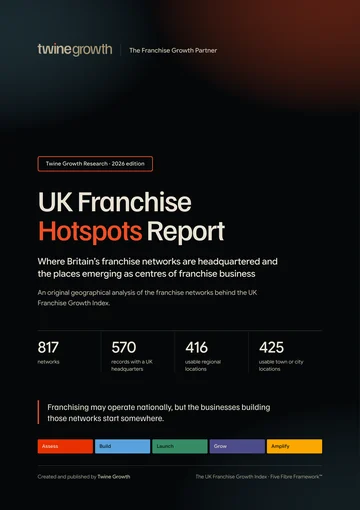
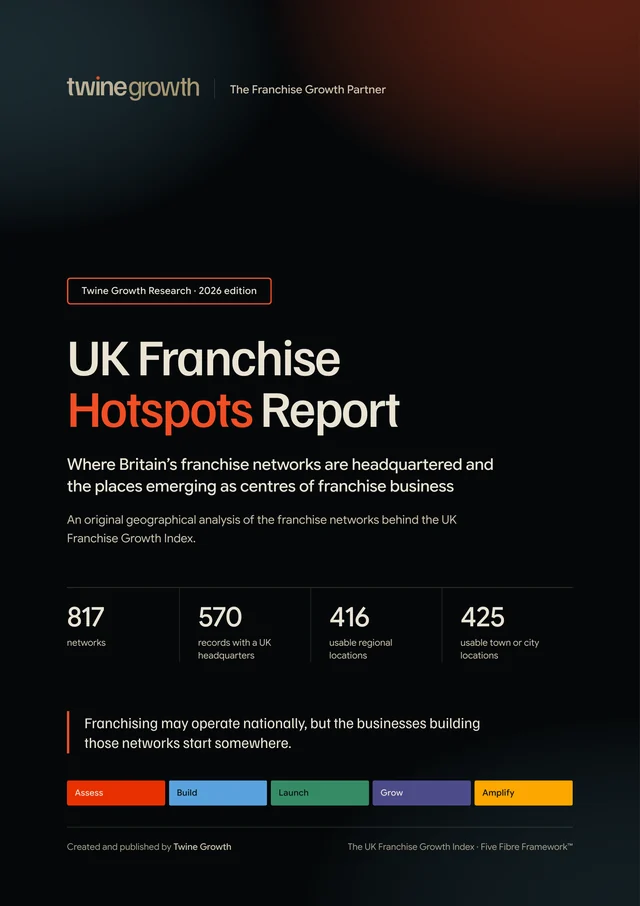
The UK Franchise Growth Index 2026 baseline contains 817 franchise networks. Of these, 570 identify the United Kingdom as the headquarters country. A reliable county or regional location is available for 416 of those UK records, while 425 provide a usable town or city location after obvious non location entries are excluded.
- London accounts for 103 of 416 networks with usable regional data, equal to 24.8% of that sample.
- The North West follows with 56 networks, while the South East contains 54.
- The three largest regional concentrations contain 213 of 416 identifiable regional headquarters.
- At town and city level, London contains 86 of 425 usable locations. Birmingham follows with 14 and Leicester with 13.
- The data also reveals a substantial long tail. The ten largest town and city concentrations contain 168 of 425 usable locations, leaving 257 spread across the rest of the identifiable sample.
Key findings
Analysis by Twine Growth found that London contains 103 of the 416 UK franchise network headquarters that can be assigned confidently to a standard region or nation, representing 24.8% of the usable regional sample.
The North West contains 56 of 416 identifiable regional headquarters in the UK Franchise Growth Index, representing 13.5% of the usable regional sample.
The South East contains 54 of 416 identifiable regional headquarters, representing 13.0% of the usable regional sample.
The three largest regional concentrations account for 213 of 416 identifiable UK headquarters, or 51.2%.
At town and city level, London contains 86 of 425 usable headquarters locations in the UK Franchise Growth Index.
Birmingham contains 14 identifiable franchise network headquarters in the usable town and city sample, while Leicester contains 13.
More findings from the report
- 168 of 425The ten largest town and city concentrations contain 168 of 425 usable headquarters locations, leaving 257 outside the top ten.
- 179Twine Growth identified 179 separate usable town and city locations across the 425 headquarters records included in its place level analysis.
Every finding is from Twine Growth’s analysis of the UK Franchise Growth Index. The base for each figure is stated in the finding itself.
What we mean by a franchise hotspot
This report measures the geographical location of the franchisor or franchise network. It does not measure the locations of individual franchisees, franchise outlets, customers or franchise employment.
If a town contains the headquarters of 20 franchise networks, that means 20 networks in the Index are headquartered there. It does not mean that town contains the greatest number of franchise units. The report therefore uses these terms:
- Franchise network headquarters
- Franchisor concentration
- Networks headquartered in a location
- Franchise businesses based in a location
- Headquarters hotspots
The geography data quality gate
The geography is useful, but it is not complete enough to justify pretending that every network can be placed precisely on a map.
Within the 570 records identifying a UK headquarters, 154 do not contain a county or regional field that can be mapped reliably to a standard UK region. They are excluded from regional calculations rather than being guessed.
Town and city analysis uses 425 records after excluding entries such as United Kingdom, Not publicly disclosed, county only values and other non town descriptions. This produces a larger usable town sample than the regional sample because some records name a town but do not provide a mappable county field.
This distinction matters. Every percentage in this report states or clearly implies the population being analysed.
The UK franchise headquarters map
The chart shows the concentration of the 416 UK headquarters records that can be assigned confidently to a standard region or nation. Bar length reflects the number of franchise network headquarters in the underlying Index sample.
The regional picture
| Region or nation | Networks | Share of 416 | Industries | Categories |
|---|---|---|---|---|
| London | 103 | 24.8% | 21 | 44 |
| North West | 56 | 13.5% | 18 | 35 |
| South East | 54 | 13.0% | 17 | 34 |
| West Midlands | 42 | 10.1% | 14 | 27 |
| South West | 41 | 9.9% | 15 | 28 |
| East Midlands | 35 | 8.4% | 13 | 24 |
| Yorkshire and the Humber | 31 | 7.5% | 13 | 26 |
| East of England | 22 | 5.3% | 11 | 18 |
| North East | 13 | 3.1% | 9 | 11 |
| Scotland | 12 | 2.9% | 9 | 11 |
| Wales | 6 | 1.4% | 3 | 3 |
| Northern Ireland | 1 | 0.2% | 1 | 1 |
How concentrated is the headquarters landscape?
London alone contains 103 of 416 identifiable regional headquarters. The top three regional concentrations contain 213, or 51.2%. The top five contain 296, or 71.2%.
That points to concentration, but not centralisation into a single place. Almost three in ten networks in the usable regional sample sit outside the five largest concentrations.
Beyond London
London is the largest single regional concentration, but 313 of the 416 identifiable regional headquarters sit elsewhere. That means 75.2% of the usable regional sample is outside London.
The largest concentrations outside London are the North West with 56 networks, the South East with 54, the West Midlands with 42 and the South West with 41.
Britain’s franchise headquarters hotspots
| Town or city | Networks | Industries | Categories | Share of 425 |
|---|---|---|---|---|
| London | 86 | 20 | 36 | 20.2% |
| Birmingham | 14 | 8 | 13 | 3.3% |
| Leicester | 13 | 5 | 9 | 3.1% |
| Bournemouth | 10 | 6 | 9 | 2.4% |
| Manchester | 10 | 7 | 9 | 2.4% |
| Leeds | 9 | 7 | 9 | 2.1% |
| Bristol | 8 | 5 | 7 | 1.9% |
| Reading | 7 | 6 | 6 | 1.6% |
| Norwich | 6 | 4 | 4 | 1.4% |
| Liverpool | 5 | 4 | 5 | 1.2% |
| Milton Keynes | 5 | 4 | 5 | 1.2% |
| Nottingham | 5 | 5 | 5 | 1.2% |
| Chester (joint 13th) | 4 | 2 | 3 | 0.9% |
| Peterborough (joint 13th) | 4 | 4 | 4 | 0.9% |
| Rochdale (joint 13th) | 4 | 3 | 4 | 0.9% |
| York (joint 13th) | 4 | 4 | 4 | 0.9% |
London is a clear outlier at town and city level. Outside London, the strongest identifiable concentrations are Birmingham, Leicester, Bournemouth, Manchester, Leeds and Bristol.
The regional franchise long tail
The ten largest town and city concentrations contain 168 of 425 usable headquarters locations, or 39.5%. The remaining 257 are distributed across the rest of the identifiable locations.
- 109 places contain one identifiable network headquarters.
- 61 places contain between two and five.
- 6 places contain between six and ten.
- 3 places contain more than ten.
The industries behind the hotspots
London
Food and Drink: 40; Childcare and Children’s Activities: 13; Cleaning Services: 6; Estate and Letting Agents: 6.
South East
Food and Drink: 8; Childcare and Children’s Activities: 7; Business Consultancy, Services and Support: 5; Care: 4; Cleaning Services: 4; Estate and Letting Agents: 4; Retail: 4.
North West
Food and Drink: 9; Retail: 7; Childcare and Children’s Activities: 6; Cleaning Services: 5; Maintenance, Building, Plumbing and Gardening: 5.
West Midlands
Food and Drink: 11; Childcare and Children’s Activities: 8; Automotive: 6; Cleaning Services: 3; Retail: 3.
South West
Childcare and Children’s Activities: 7; Food and Drink: 6; Cleaning Services: 5; Business Consultancy, Services and Support: 4.
East Midlands
Cleaning Services: 8; Food and Drink: 8; Business Consultancy, Services and Support: 3; Childcare and Children’s Activities: 3; Retail: 3.
These counts describe the industry mix of franchise networks headquartered in each region. They do not measure customer demand or franchise unit density within those regions.
Where newer franchise networks are emerging
For this analysis, a newer network is defined as one with a publicly identifiable franchising start year of 2021 or later. Percentages use only records where a franchising start year is available.
| Region or nation | Started 2021 onward | Known start year | Share of known |
|---|---|---|---|
| London | 18 | 48 | 37.5% |
| North West | 8 | 31 | 25.8% |
| South East | 5 | 32 | 15.6% |
| West Midlands | 7 | 24 | 29.2% |
| South West | 3 | 22 | 13.6% |
| East Midlands | 6 | 24 | 25.0% |
| Yorkshire and the Humber | 8 | 19 | 42.1% |
| East of England | 1 | 15 | 6.7% |
| North East | 3 | 9 | 33.3% |
| Scotland | 2 | 3 | 66.7% |
| Wales | 0 | 3 | 0.0% |
| Northern Ireland | 0 | 1 | 0.0% |
London contains the largest absolute number of newer networks in the known year sample. The North West and Yorkshire and the Humber also contain notable counts. Smaller samples, particularly Scotland, should not be treated as directly comparable percentages without considering the denominator.
Franchise investment by region
Investment analysis uses the publicly recorded minimum investment field. Missing values are excluded rather than treated as zero.
| Region or nation | Median minimum investment | Known investment records | Networks |
|---|---|---|---|
| London | £25,000 | 57 | 103 |
| North West | £22,750 | 32 | 56 |
| South East | £20,000 | 39 | 54 |
| West Midlands | £35,000 | 30 | 42 |
| South West | £17,273 | 32 | 41 |
| East Midlands | £15,000 | 19 | 35 |
| Yorkshire and the Humber | £20,475 | 20 | 31 |
| East of England | £27,500 | 15 | 22 |
| North East | £5,000 | 7 | 13 |
| Scotland | £97,500 | 4 | 12 |
| Wales | £12,500 | 4 | 6 |
| Northern Ireland | Not enough data | 0 | 1 |
The range between regional medians is substantial, but the known investment sample varies sharply by region. Scotland, for example, has only four known minimum investment values in this dataset. That makes the figure descriptive rather than a robust estimate of the whole Scottish franchise market.
Home based and mobile franchise headquarters
Home based
London: 41, North West: 29, South East: 29, South West: 26, West Midlands: 18, East Midlands: 17, Yorkshire and the Humber: 15, East of England: 12.
Mobile
London: 27, South East: 20, North West: 19, South West: 17, West Midlands: 17, East Midlands: 12, Yorkshire and the Humber: 12, East of England: 11.
These figures show where the franchisors behind home based and mobile propositions are headquartered. They do not show where their franchisees operate.
Five Fibre geography
The Five Fibre Framework™ provides a consistent way to examine publicly identifiable growth infrastructure across Assess, Build, Launch, Grow and Amplify. Regional averages are descriptive profiles, not regional league tables.
| Region | Assess | Build | Launch | Grow | Amplify |
|---|---|---|---|---|---|
| London | 16.5 | 16.5 | 15.4 | 12.1 | 14.5 |
| North West | 17.0 | 17.2 | 16.1 | 12.9 | 15.3 |
| South East | 17.0 | 17.2 | 16.2 | 13.0 | 15.3 |
| West Midlands | 16.7 | 16.7 | 15.5 | 12.1 | 14.7 |
| South West | 17.3 | 17.4 | 16.0 | 13.2 | 15.5 |
| East Midlands | 16.4 | 16.5 | 15.3 | 12.4 | 14.4 |
| Yorkshire and the Humber | 16.8 | 16.7 | 15.4 | 12.4 | 14.4 |
| East of England | 16.3 | 16.5 | 15.4 | 12.5 | 14.6 |
| North East | 17.0 | 17.0 | 16.1 | 12.5 | 15.4 |
| Scotland | 15.6 | 15.4 | 14.8 | 11.6 | 13.8 |
| Wales | 17.7 | 17.7 | 16.3 | 13.9 | 16.0 |
| Northern Ireland | 17.5 | 18.0 | 16.0 | 12.5 | 16.0 |
Across every region, Grow is the lowest average of the five Fibres. The pattern appears geographically widespread within this Index sample rather than isolated to one part of the UK.
Regional intelligence cards
London
- 103 identifiable network headquarters, representing 24.8% of the 416 regional sample.
- 21 industries and 44 franchise categories represented.
- Median network age since franchising began: 9 years, based on 48 known start years.
- Median publicly recorded minimum investment: £25,000, based on 57 known values.
- Five Fibre profile: Assess 16.5, Build 16.5, Launch 15.4, Grow 12.1, Amplify 14.5.
South East
- 54 identifiable network headquarters, representing 13.0% of the 416 regional sample.
- 17 industries and 34 franchise categories represented.
- Median network age since franchising began: 21.5 years, based on 32 known start years.
- Median publicly recorded minimum investment: £20,000, based on 39 known values.
- Five Fibre profile: Assess 17.0, Build 17.2, Launch 16.2, Grow 13.0, Amplify 15.3.
North West
- 56 identifiable network headquarters, representing 13.5% of the 416 regional sample.
- 18 industries and 35 franchise categories represented.
- Median network age since franchising began: 21 years, based on 31 known start years.
- Median publicly recorded minimum investment: £22,750, based on 32 known values.
- Five Fibre profile: Assess 17.0, Build 17.2, Launch 16.1, Grow 12.9, Amplify 15.3.
West Midlands
- 42 identifiable network headquarters, representing 10.1% of the 416 regional sample.
- 14 industries and 27 franchise categories represented.
- Median network age since franchising began: 16 years, based on 24 known start years.
- Median publicly recorded minimum investment: £35,000, based on 30 known values.
- Five Fibre profile: Assess 16.7, Build 16.7, Launch 15.5, Grow 12.1, Amplify 14.7.
South West
- 41 identifiable network headquarters, representing 9.9% of the 416 regional sample.
- 15 industries and 28 franchise categories represented.
- Median network age since franchising began: 18.5 years, based on 22 known start years.
- Median publicly recorded minimum investment: £17,273, based on 32 known values.
- Five Fibre profile: Assess 17.3, Build 17.4, Launch 16.0, Grow 13.2, Amplify 15.5.
East Midlands
- 35 identifiable network headquarters, representing 8.4% of the 416 regional sample.
- 13 industries and 24 franchise categories represented.
- Median network age since franchising began: 13.5 years, based on 24 known start years.
- Median publicly recorded minimum investment: £15,000, based on 19 known values.
- Five Fibre profile: Assess 16.4, Build 16.5, Launch 15.3, Grow 12.4, Amplify 14.4.
Yorkshire and the Humber
- 31 identifiable network headquarters, representing 7.5% of the 416 regional sample.
- 13 industries and 26 franchise categories represented.
- Median network age since franchising began: 9 years, based on 19 known start years.
- Median publicly recorded minimum investment: £20,475, based on 20 known values.
- Five Fibre profile: Assess 16.8, Build 16.7, Launch 15.4, Grow 12.4, Amplify 14.4.
East of England
- 22 identifiable network headquarters, representing 5.3% of the 416 regional sample.
- 11 industries and 18 franchise categories represented.
- Median network age since franchising began: 25 years, based on 15 known start years.
- Median publicly recorded minimum investment: £27,500, based on 15 known values.
- Five Fibre profile: Assess 16.3, Build 16.5, Launch 15.4, Grow 12.5, Amplify 14.6.
What surprised us?
- London is the largest headquarters concentration, but more than three quarters of the usable regional sample sits outside London.
- The top three regions contain just over half of the usable regional headquarters sample, while the remainder is spread across nine other regions and nations.
- At town and city level, the ten largest concentrations account for only 39.5% of usable locations, leaving a long geographical tail.
- Birmingham and Leicester emerge as the largest identifiable town and city concentrations outside London in the current dataset.
- Grow is the lowest average Five Fibre score in every regional profile, suggesting the publicly visible growth infrastructure gap is geographically widespread.
Ten things the franchise map tells us
- 01The UK Franchise Growth Index 2026 baseline contains 817 franchise networks.
- 02570 records identify the United Kingdom as the headquarters country.
- 03416 UK records can be assigned confidently to a standard region or nation.
- 04London contains 103 of those 416 regional headquarters, equal to 24.8%.
- 05The North West contains 56 of 416, equal to 13.5%.
- 06The South East contains 54 of 416, equal to 13.0%.
- 07The three largest regional concentrations contain 213 of 416 networks, equal to 51.2%.
- 08425 records provide a usable town or city location for headquarters analysis.
- 09London contains 86 of those 425 town or city records, equal to 20.2%.
- 10The ten largest town and city concentrations contain 168 of 425 usable locations, equal to 39.5%.
Methodology
- Primary source: the UK Franchise Growth Index 2026 dataset.
- Research population: 817 franchise networks.
- Data cut off and publication period: September 2026.
- Headquarters country is taken from the Index field labelled Headquarters Country.
- Regional analysis includes only UK headquarters records whose county or region field can be mapped confidently to a standard UK region or nation.
- Town and city analysis excludes obvious non location values and normalises address strings only where a town or city can be extracted without guessing. A town is read from the Headquarters Town/City field as written, with a county, region or country after the town name dropped and different spellings of the same town merged; a street address with a postcode is read as the last place named before the postcode that is not a county, region or country. Entries that are not a single UK town or city are left out: county, region and country names, the district names North London and South Manchester (each part of a city, not a town), company or operation descriptions, places outside the UK, entries naming more than one place (including a locality followed by its town) and addresses with no town, as well as London street addresses.
- Registered office addresses are not independently substituted for operational headquarters.
- International headquarters are not treated as UK headquarters simply because a network operates in the UK.
- Missing investment values are excluded from investment calculations.
- Franchising start year is extracted only where a four digit year is present in the Index field.
- Five Fibre regional profiles use the scores already recorded in the Index.
- No causal relationship is inferred from geographical associations.
Regional classification
England is grouped into North East, North West, Yorkshire and the Humber, East Midlands, West Midlands, East of England, London, South East and South West. Scotland, Wales and Northern Ireland are shown separately.
Repeatability
The same rules can be applied to future versions of the UK Franchise Growth Index so that changes in headquarters concentration can be tracked over time.
This report uses the shared Index methodology, set out in full in how the UK Franchise Growth Index was created, plus the report-specific method above.
Research limitations
- Headquarters location does not show where franchisees operate.
- Headquarters location does not show where customers are located.
- Headquarters concentration does not measure local franchise revenue, employment or unit count.
- Some headquarters information is not publicly available.
- Registered office and operational headquarters may differ.
- Headquarters can relocate and networks can launch, merge, rebrand or cease operating.
- The regional sample excludes UK records without a reliable county or regional field.
- Town and city normalisation is deliberately conservative. Ambiguous entries are excluded rather than inferred.
- Five Fibre scores measure publicly identifiable evidence contained in the Index.
- Correlation is not presented as causation.
For journalists
- Report
- UK Franchise Hotspots Report
- Publisher
- Twine Growth
- Publication date
- 30 September 2026
- Research source
- The UK Franchise Growth Index
- Research population
- 817 networks
- Sample for this report
- 416 UK records mapped to a standard region
- Data snapshot
- 22 September 2026
- Methodology
- Methodology for this report and the Index methodology
- Permanent link
- https://www.twinegrowth.com/uk-franchise-growth-index/reports/uk-franchise-hotspots-report/
- Media enquiries
- Contact Twine Growth
Source: Twine Growth, the UK Franchise Growth Index
Journalist summary
For media use, statistics should retain the denominator shown in this report. Where a figure uses a subset, such as known investment or known franchising start year, that subset should remain explicit.
Corrections and updates
- Published
- 30 September 2026
- Last updated
- 1 October 2026
- Version
- 1.0 (PDF version 1.0)
- Data snapshot
- 22 September 2026
No corrections have been issued for this edition.
If you represent a franchise network and something in this report is wrong or out of date, send us the evidence and we will review it. Corrections are recorded here, and the page address never changes.