Executive summary
Recruiting another franchisee grows the network. It does not automatically grow the franchisee’s business. Once the agreement is signed, another commercial challenge begins: where will their customers come from?
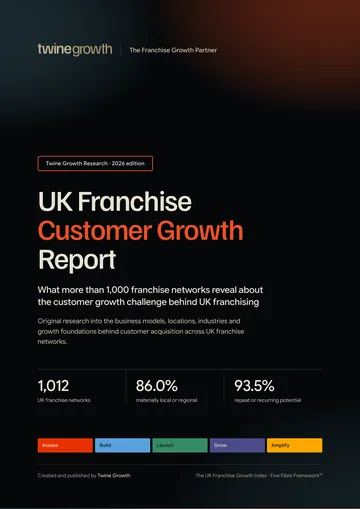
This report examines that second growth engine. It uses the 1,012 network records in the UK Franchise Growth Index and applies a transparent structural classification to the business model information already held in the Index. It does not claim to measure customer acquisition performance, retention, profitability or marketing ROI.
Headline finding
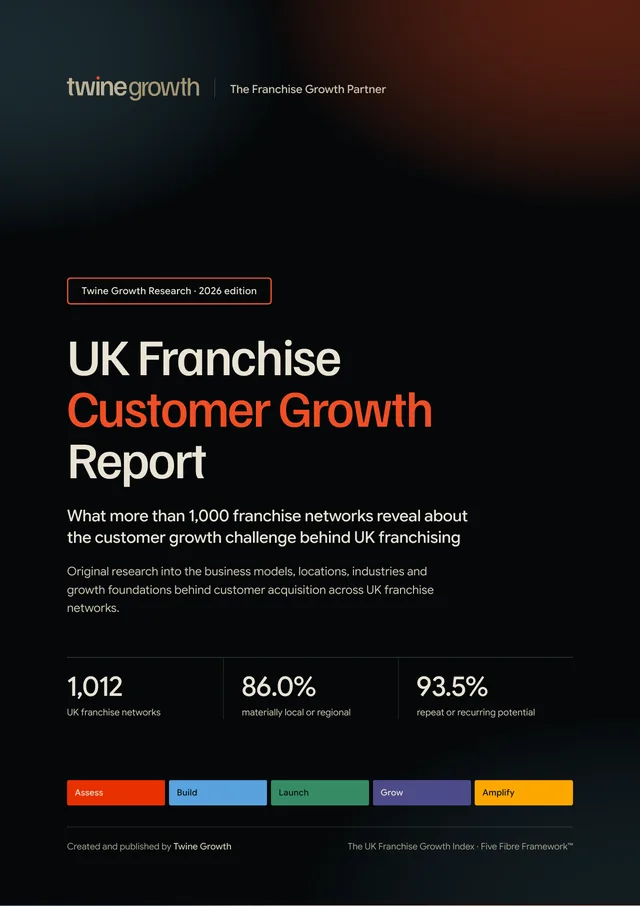
870 of 1,012 network records (86.0%) are structurally dependent on customers within a local or regional market under the report’s classification rules. This is a structural measure, not a performance score.
Key findings
Analysis by Twine Growth found that 870 of 1,012 UK franchise network records (86.0%) operate in business models classified as materially dependent on local or regional customers.
The 195 franchise networks with usable location data represent 50,493 publicly identified operating locations, with a median network size of 60 locations.
946 of 1,012 network records (93.5%) operate in models with inherent repeat or recurring customer potential.
427 of 1,012 network records (42.2%) are marked as retail premises franchises in the UK Franchise Growth Index.
552 of 1,012 network records (54.5%) are marked as home based, while 386 (38.1%) are marked as mobile.
The median stated minimum investment across the Index is £20,000; the mean is £52,471.
More findings from the report
- 86.0%Among the 1,003 networks recorded as actively recruiting or selectively recruiting, 86.0% are structurally local or regional.
- 16.4Across the complete Index, the average Five Fibre scores are 16.4 Assess, 16.4 Build, 15.3 Launch, 12.1 Grow and 14.4 Amplify, each out of 20.
Every finding is from Twine Growth’s analysis of the UK Franchise Growth Index. The base for each figure is stated in the finding itself.
What this report measures
Franchise Customer Growth is the ability of a franchise network to create an environment in which individual franchise businesses can repeatedly attract, convert, retain and grow customers within their own markets.
The master Index contains public franchise network information such as industry, category, network size, operating model, investment, recruitment status and Five Fibre scores. It does not contain franchisee turnover, customer numbers, acquisition cost, conversion rates, retention rates, lifetime value, lead volumes or individual franchise profitability. Those outcomes are therefore not inferred.
The customer growth journey
The two growth engines of franchising
A franchise network contains two separate growth engines. Network Growth creates franchise businesses. Customer Growth helps make those businesses commercially sustainable. One cannot be substituted for the other.
One brand can therefore contain dozens or hundreds of separate customer growth challenges, each shaped by territory, competition, owner execution and local demand.
From networks to customer markets
The Index contains 1,012 franchise network records. A usable numerical location count is available for 195 of them. Those networks alone represent 50,493 publicly identified locations, with a median of 60 locations and a mean of 258.9.
The gap between the median and mean shows why averages need care: a relatively small number of very large networks pull the mean upwards. This report therefore uses medians as the primary measure for investment and network size comparisons.
Each location does not necessarily represent an exclusive customer market. The location count is used only to show how network expansion multiplies the number of operating businesses that need demand.
How franchise businesses meet customers
Each network is assigned one primary interaction model using its public description, category and operating format. Where models overlap, the classification reflects the dominant route into the customer relationship.
| Primary interaction | Networks | Share |
|---|---|---|
| Booking | 311 | 30.7% |
| Visit | 285 | 28.2% |
| Contract | 193 | 19.1% |
| Contact | 177 | 17.5% |
| Membership | 45 | 4.4% |
| Purchase | 1 | 0.1% |
How much of UK franchising depends on local customers?
Under the report’s structural rules, 870 of 1,012 network records (86.0%) are classified as Highly Local or Regionally Dependent. This reflects the prevalence of premises, mobile services, home based territory businesses and other models where proximity materially shapes customer acquisition.
Among networks with a usable location count, those materially local or regional models account for 47,183 identified locations. Missing location counts are not estimated.
Three operating models, three customer growth environments
These flags can overlap. A network can, for example, offer both home based and mobile operation. They should therefore be read as operating characteristics rather than mutually exclusive segments.
| Model | Networks | Median investment | Median locations* | Avg Five Fibre |
|---|---|---|---|---|
| Retail premises | 427 | £52,500 | 80 | 76.8 |
| Mobile | 386 | £13,950 | 40 | 74.2 |
| Home based | 552 | £12,500 | 50 | 73.2 |
*Median location figures use only records with a usable numerical location count.
B2C, B2B and mixed customer markets
The structural classification indicates that consumer facing models dominate the Index, but a meaningful B2B population operates with a different route to customer growth, often centred on lead generation, consultative selling, contracts and account retention.
| Customer type | Networks | Share | Median investment | Avg Five Fibre |
|---|---|---|---|---|
| B2B | 146 | 14.4% | £18,435 | 72.2 |
| B2C | 814 | 80.4% | £20,250 | 75.3 |
| Mixed | 52 | 5.1% | £20,000 | 75.4 |
The repeat customer economy
946 of 1,012 network records (93.5%) operate in business models classified as having natural repeat or recurring customer potential. This does not mean those networks achieve high retention. It means the underlying service or product can naturally support an ongoing customer relationship.
| Relationship structure | Networks | Share | Median investment | Median locations* |
|---|---|---|---|---|
| Primarily Transactional | 66 | 6.5% | £20,000 | 80 |
| Recurring | 619 | 61.2% | £15,995 | 70 |
| Repeat Potential | 327 | 32.3% | £50,000 | 45 |
Customer growth by industry
Industry changes the customer growth problem. Food and drink networks are overwhelmingly local and visit led. Business consultancy and professional services contain a much larger location flexible population. Cleaning, care and children’s activities combine strong local dependency with recurring or repeat relationships.
| Industry | Networks | Local / regional | Repeat / recurring | Median invest. | Avg score |
|---|---|---|---|---|---|
| Food and Drink | 192 | 100% | 100% | £100,000 | 72.9 |
| Childcare and Children’s Activities | 140 | 99% | 100% | £9,872 | 77.5 |
| Business Consultancy, Services and Support | 97 | 24% | 100% | £16,000 | 71.9 |
| Cleaning Services | 84 | 100% | 100% | £14,950 | 76.0 |
| Retail | 47 | 100% | 100% | £45,000 | 78.3 |
| Care | 46 | 100% | 100% | £35,995 | 77.2 |
| Education and Tuition | 42 | 76% | 100% | £9,995 | 76.2 |
| Fitness | 40 | 100% | 100% | £88,000 | 77.2 |
| Maintenance, Building, Plumbing and Gardening | 36 | 100% | 100% | £19,995 | 76.2 |
| Estate and Letting Agents | 34 | 59% | 100% | £21,250 | 77.4 |
| Home Improvement and Renovations | 34 | 100% | 100% | £19,995 | 73.9 |
| Automotive | 30 | 100% | 100% | £19,875 | 74.7 |
Investment changes the customer growth context
The median stated minimum investment across all 1,012 network records is £20,000. Premises based networks have a median stated minimum investment of £52,500, compared with £12,500 for home based networks and £13,950 for mobile networks.
That difference matters because capital intensity and customer acquisition are separate questions. A larger upfront investment does not remove the need for local demand, enquiries, bookings, contracts or repeat customers.
| Minimum investment band | Networks | Share |
|---|---|---|
| Up to £10k | 142 | 14.0% |
| £10k to £25k | 175 | 17.3% |
| £25k to £50k | 95 | 9.4% |
| £50k to £100k | 52 | 5.1% |
| £100k plus | 69 | 6.8% |
Customer growth and network maturity
An exact franchise start year can be extracted for 396 of the 1,012 network records. The remaining 616 are treated as Unknown for maturity analysis rather than estimated.
| Maturity cohort | Networks | Local / regional | Repeat / recurring | Median invest. | Avg score |
|---|---|---|---|---|---|
| New Generation | 98 | 89% | 96% | £25,000 | 69.8 |
| Developing | 62 | 90% | 97% | £23,488 | 75.9 |
| Established | 99 | 89% | 97% | £19,975 | 81.8 |
| Mature | 57 | 95% | 93% | £20,475 | 83.8 |
| Long Standing | 80 | 90% | 91% | £30,000 | 82.7 |
Maturity is descriptive. It does not establish that older or newer networks have better customer growth performance.
What are prospective franchisees buying into today?
1,003 of 1,012 network records are recorded as Active, Recruiting, Limited, Selective or recruiting UK area developers. That means the current opportunity market is broad, but the underlying customer growth mechanics vary sharply.
These figures describe the customer environment behind the opportunities being marketed. They do not measure how successfully individual franchisees win customers.
Customer growth through the Five Fibres
The Five Fibre Framework™ is used here as a secondary lens. Customer growth should not be reduced to the Grow Fibre alone. Sustainable growth depends on connected foundations across Assess, Build, Launch, Grow and Amplify.
Across the complete Index, Assess and Build average 16.4 out of 20, Launch 15.3, Grow 12.1 and Amplify 14.4. These are public evidence scores from the Index methodology. They are not direct measures of customer acquisition performance.
The customer growth connection map
Customer growth sits across the franchise system. A national brand can create recognition, but the local business still has to convert that recognition into demand, delivery, return visits and advocacy.
What the Index cannot yet tell us
A valuable next research layer is who actually owns customer growth inside each network. The current master Index does not consistently record national marketing, local marketing support, lead generation, CRM, review generation, retention support, referral support, launch campaigns or marketing levies.
Those fields are therefore not scored or estimated in this edition. Publishing invented support statistics would weaken the Index. The correct next step is a separate, dated public evidence audit using consistent definitions.
| Evidence status | Meaning |
|---|---|
| YES | Public evidence clearly identifies the support |
| NO PUBLIC EVIDENCE | Nothing reliable identified in the reviewed public material |
| NOT APPLICABLE | The support field does not apply to the model |
Crucially, “No public evidence” must never be rewritten as “No support provided”. The former is an evidence statement. The latter would be an unsupported claim.
The next dataset: Customer Growth Support
A supplementary Customer Growth Support dataset would allow Twine Growth to measure the transparency of post sale growth support without confusing disclosure with quality.
- National marketing
- Local marketing support
- Launch campaign support
- Lead generation support
- Website or local page provision
- CRM
- Paid advertising support
- Social support
- Email marketing support
- Review support
- Referral support
- Customer retention support
- Marketing training
- Marketing assets
- Central content
- Marketing levy
- Required local marketing spend
Once researched, these fields can support a Customer Growth Support Transparency Measure and a clear analysis of whether responsibility appears primarily central, shared, primarily local or unclear.
What surprised us
of the Index is structurally local or regional in customer dependency.
of networks sit in models with natural repeat or recurring customer potential.
networks are marked retail premises / home based / mobile respectively.
identified locations sit inside just 195 networks with a usable numerical location count.
is the mean stated minimum investment, more than twice the £20,000 median.
is the average Grow Fibre score, below the other four Fibre averages in the master Index.
Ten things we learned
- 01870 of 1,012 network records (86.0%) are materially local or regional under the structural classification.
- 02946 of 1,012 network records (93.5%) have repeat or recurring customer potential.
- 03427 of 1,012 network records (42.2%) are marked as retail premises models.
- 04386 of 1,012 network records (38.1%) are marked as mobile models.
- 05552 of 1,012 network records (54.5%) are marked as home based models.
- 06814 of 1,012 network records are classified primarily B2C.
- 07195 networks with usable location counts represent 50,493 identified locations.
- 08The median stated minimum investment is £20,000, compared with a mean of £52,471.
- 09396 of 1,012 network records have a franchise start year suitable for maturity analysis.
- 10The average Grow Fibre score is 12.1/20, compared with 16.4/20 for Assess and 16.4/20 for Build.
The question underneath franchise growth
At ten locations, the customer growth challenge exists ten times.
At fifty locations, fifty times.
At one hundred locations, one hundred times.
The network can create the brand, the systems, the proposition and the platform. But each operating franchise still needs customers to discover it, choose it, buy from it, return to it and recommend it.
That is why customer growth is not a side issue in franchising. It is the commercial engine underneath the network.
Methodology
Research population
The master UK Franchise Networks Index contains 1,012 franchise network records. The analysis uses the spreadsheet as it stood on 22 September 2026.
Structural classifications
Customer Type, Local Customer Dependency, Customer Relationship and Primary Interaction are derived from the network description, industry, category and the Home Based, Mobile and Retail Premises flags. Rules are applied consistently across all records. These are analytical classifications, not claims made by the franchise networks themselves.
Location counts
Approx Locations is converted to a numerical value only where the field contains a usable number. 195 of 1,012 records meet that condition. “No Public Record Available” and other non numerical values are excluded rather than estimated.
Maturity
Franchise start years are extracted only where an explicit four digit year is present. 396 records meet that condition. The remainder are classified as Unknown.
Recruitment
Active recruitment includes records labelled Active, Recruiting, Limited, Selective or Recruiting UK Area Developers. Resales only and records where recruitment is not publicly stated are excluded from the active cohort.
Investment
Investment comparisons use the stated Investment From field. Medians are prioritised because high investment outliers materially affect the mean.
Five Fibre
Five Fibre analysis uses the Assess, Build, Launch, Grow and Amplify scores already contained in the master Index. This report does not rescore those networks.
Records and networks: the 2026 workbook holds 1,012 network records. Twenty-two network names appear twice in it, so the live UK Franchise Growth Index, which lists each network once, shows 990 networks. This report analyses all 1,012 records as the frozen 2026 baseline. Counting each network once would leave the median stated minimum investment at £20,000, the median network at 60 identifiable locations and the average Grow score at 12.1, and would move the operating model shares by less than one percentage point. The structural classifications in this report were not recalculated for that check.
This report uses the shared Index methodology, set out in full in how the UK Franchise Growth Index was created, plus the report-specific method above.
Research limitations
- The Index describes publicly researched franchise network characteristics. It does not contain franchisee turnover, customer numbers, customer acquisition cost, conversion rates, retention rates, lifetime value, marketing ROI, lead volumes or individual franchise profitability.
- Local Customer Dependency is a structural classification. It does not measure local marketing performance.
- Repeat potential describes the business model. It does not prove customer retention.
- Operating model flags can overlap and should not be added together as if they were mutually exclusive.
- Public information changes. Network size, investment and recruitment status are snapshots.
- No figures from the supplementary Customer Growth Support audit have been estimated from incomplete evidence. Until that audit is completed, the report does not publish statistics about CRM, lead generation, marketing levies, retention support or who owns customer growth.
- Association does not establish causation. Five Fibre differences should not be interpreted as proof that one structure causes another.
For journalists
- Report
- UK Franchise Customer Growth Report
- Publisher
- Twine Growth
- Publication date
- 30 September 2026
- Research source
- The UK Franchise Growth Index
- Research population
- 1,012 network records
- Sample for this report
- 1,012 network records (every record in the Index)
- Data snapshot
- 22 September 2026
- Methodology
- Methodology for this report and the Index methodology
- Permanent link
- https://www.twinegrowth.com/uk-franchise-growth-index/reports/uk-franchise-customer-growth-report/
- Media enquiries
- Contact Twine Growth
Source: Twine Growth, the UK Franchise Growth Index
Central editorial story
A franchise network does not grow just because it adds franchisees. Each new franchisee creates another operating business that needs customers. That makes customer growth the multiplier hidden underneath franchise growth.
Corrections and updates
- Published
- 30 September 2026
- Last updated
- 30 September 2026
- Version
- 1.0 (PDF version 1.0)
- Data snapshot
- 22 September 2026
No corrections have been issued for this edition.
If you represent a franchise network and something in this report is wrong or out of date, send us the evidence and we will review it. Corrections are recorded here, and the page address never changes.