Executive summary
Franchise growth does not start with selling franchises. It starts with establishing whether the underlying model deserves to be replicated.
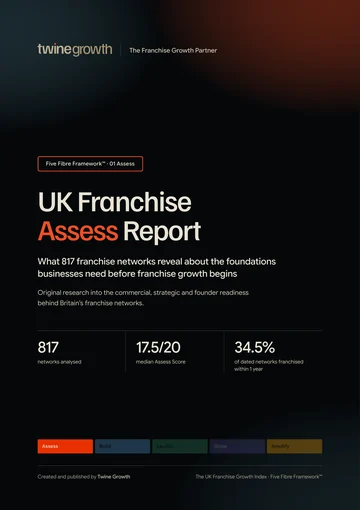
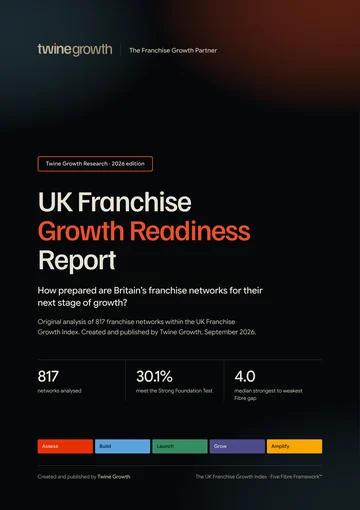
This report analyses 817 franchise networks in the UK Franchise Growth Index. It focuses on evidence already captured in the Index: Assess scores, business and franchising dates, investment, operating model, network scale, recruitment status, origin and the relationship between Assess and the other Five Fibres.
Eight findings to know
- The median Assess Score is 17.5/20 across all 817 networks.
- 263 of 817 networks (32.2%) score 18 or higher on Assess.
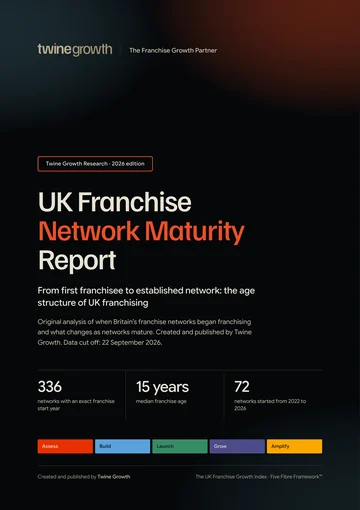
- Among 322 networks where both dates can be established, the median business traded for 4 years before franchising.
- 111 of those 322 networks (34.5%) began franchising within one year of founding.
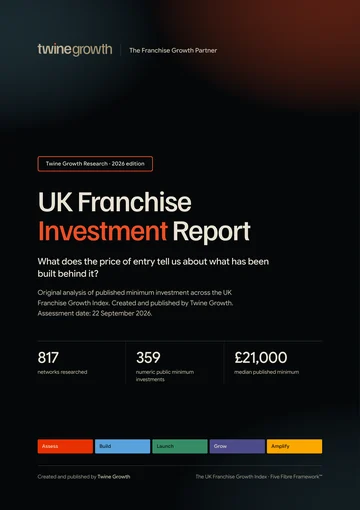
- A minimum investment is recorded for 359 of 817 networks (43.9%); the median recorded minimum is £21,000.
- 191 of 359 networks with a recorded minimum (53.2%) sit below £25,000.
- Assess and Build scores are very closely associated across all 817 networks (Spearman ρ=0.96).
- 738 of 817 networks (90.3%) have Assess and Build scores within one point of each other.
Key findings
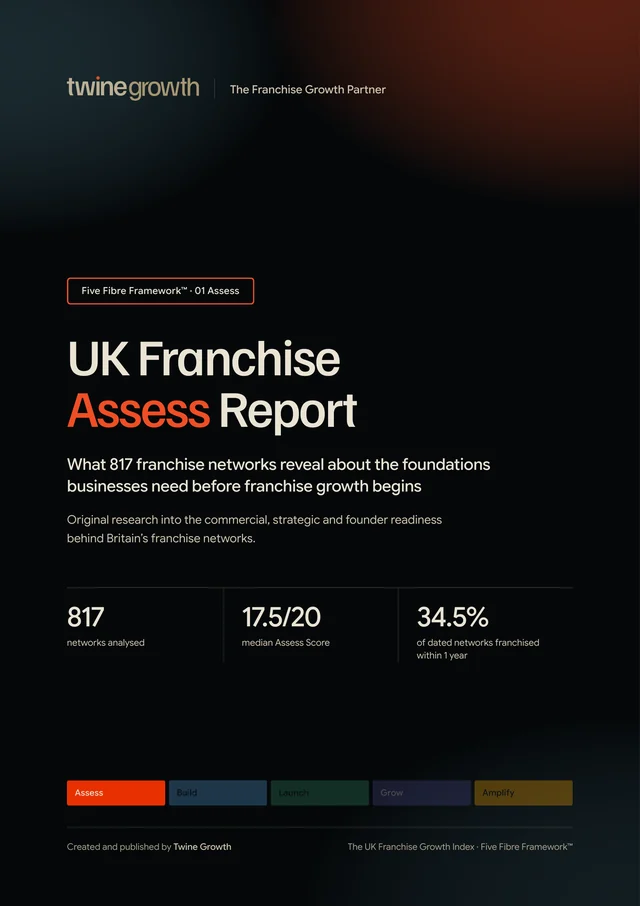
The median Assess Score across all 817 networks was 17.5/20.
263 of 817 networks (32.2%) scored 18 or higher on Assess.
809 of 817 networks (99.0%) were recorded in an active recruitment status.
A minimum investment was recorded for 359 networks (43.9% of the Index).
The median recorded minimum investment was £21,000.
The mean recorded minimum investment was £54,562.
More findings from the report
- 24.8%89 of 359 networks with a recorded minimum (24.8%) were below £10,000.
- 53.2%191 of 359 (53.2%) were below £25,000.
- 5.0%18 of 359 (5.0%) had a recorded minimum of at least £250,000.
- 29.1%Both minimum and maximum investment figures were recorded for 238 of 817 networks (29.1%).
- 4The median pre franchise trading period was 4 years among 322 networks with usable dates.
- 34.5%111 of 322 dated networks (34.5%) began franchising within one year.
- 28.0%90 of 322 dated networks (28.0%) traded for 11 years or more first.
- 53.4%436 of 817 networks (53.4%) were classified as home based.
- 42.8%350 of 817 networks (42.8%) were classified as requiring retail premises.
- 67.7%553 of 817 networks (67.7%) were classified as management franchises.
- 69.4%567 of 817 networks (69.4%) were classified as executive franchises.
- 0.96Assess and Build had a Spearman correlation of ρ=0.96 across 817 networks.
- 90.3%738 of 817 networks (90.3%) had Assess and Build scores within one point.
- 817Twine Growth analysed 817 franchise networks for the UK Franchise Assess Report.
Every finding is from Twine Growth’s analysis of the UK Franchise Growth Index. The base for each figure is stated in the finding itself.
Should this model be scaled?
Assess is the extent to which a business has established the commercial, strategic and structural foundations required to support a viable franchise model before significant franchise growth begins.
The five questions behind Assess
- Is the core business model proven and profitable?
- Could it operate successfully for 30 days without daily founder involvement?
- Is the ideal franchisee clearly understood?
- Can a franchisee realistically make money by following the model?
- Is the franchise opportunity differentiated from alternatives in the market?
The Franchise Readiness Chain
The master Index does not contain structured fields for every private commercial question in this chain. Where evidence is not captured consistently, this report does not manufacture a national statistic.
The UK franchise foundation landscape
| Index field | Networks | Coverage |
|---|---|---|
| Minimum investment recorded | 359 | 43.9% |
| Maximum investment recorded | 244 | 29.9% |
| Both investment bounds recorded | 238 | 29.1% |
| Founded year identifiable | 647 | 79.2% |
| Franchising start year identifiable | 352 | 43.1% |
| Approx franchisee count identifiable | 325 | 39.8% |
| Approx location count identifiable | 171 | 20.9% |
Operating model
| Model signal | Networks | Share of Index |
|---|---|---|
| Home based | 436 | 53.4% |
| Mobile | 313 | 38.3% |
| Retail premises | 350 | 42.8% |
| Management franchise | 553 | 67.7% |
| Executive franchise | 567 | 69.4% |
| Master franchise available | 211 | 25.8% |
How Assess scores are distributed
The distribution is concentrated in the upper half of the 20 point Assess scale. 448 of 817 networks (54.8%) score 17 or higher. This is a Five Fibre assessment result, not a guarantee of profitability, franchisee returns or future growth.
What does it cost to enter UK franchising?
A minimum investment is recorded for 359 networks. Across that disclosed subset, the median is £21,000, while the mean is £54,562. The large difference between mean and median reflects a long upper tail of capital intensive opportunities.
These figures describe the values recorded in the Index. A stated “investment from” figure should not be treated as the total capital required to open and operate a franchise.
A from price is not the whole economics
Only 238 of 817 networks (29.1%) have both an Investment From and Investment To figure recorded in the master Index. That is a visibility finding, not a judgement about the commercial quality of the remaining networks.
What the master Index cannot establish consistently
- Franchise fee versus total investment
- Working capital requirement
- Ongoing management fee
- Marketing levy
- Property, equipment, stock and vehicle costs
- Break even and payback period
- Actual franchisee profit or margin
Those fields would require a separate structured live site and disclosure audit. They are deliberately excluded from headline claims in this edition.
Capital structure changes with the model
| Model | Networks | With min. investment | Median minimum | Median Assess |
|---|---|---|---|---|
| Home based | 436 | 195 | £12,500 | 17.0 |
| Mobile | 313 | 144 | £12,500 | 17.0 |
| Retail premises | 350 | 152 | £50,000 | 17.5 |
| Management | 553 | 229 | £35,000 | 17.5 |
| Executive | 567 | 238 | £35,000 | 17.5 |
The contrast is structural rather than evaluative. Premises based models in this dataset have a higher recorded median minimum investment than home based and mobile models, reflecting different capital requirements.
How long do businesses wait before franchising?
The median is 4 years, based on 322 networks where both founding and franchising start dates can be established.
111 of 322 dated networks (34.5%) began franchising within one year of founding. A further 17 (5.3%) began in year two. At the other end, 90 (28.0%) traded for 11 years or more before franchising.
The timing itself does not establish whether a network was ready. It shows how differently businesses approach the period between founding and franchising.
Trading history shows only a weak relationship with Assess
| Time before franchising | Networks | Median Assess | Median overall |
|---|---|---|---|
| 0–1 years | 111 | 17.5 | 81.0 |
| 2 years | 17 | 17.5 | 78.0 |
| 3–5 years | 54 | 16.75 | 76.75 |
| 6–10 years | 50 | 17.5 | 75.5 |
| 11+ years | 90 | 18.0 | 84.0 |
The association between years before franchising and Assess Score is weak (Spearman ρ=0.11, n=322). The data therefore does not support a simple claim that waiting longer automatically produces stronger Assess results.
Franchise foundations sit inside very different industries
| Industry | Networks | Median Assess | Median min. investment | Median years before franchising |
|---|---|---|---|---|
| Food and Drink | 163 | 16.0 | £100,000 | 5.5 |
| Childcare and Children’s Activities | 115 | 17.5 | £8,998 | 3.0 |
| Business Consultancy, Services and Support | 69 | 16.0 | £18,500 | 3.5 |
| Cleaning Services | 66 | 17.25 | £14,968 | 4.0 |
| Retail | 42 | 17.75 | £50,000 | 8.5 |
| Care | 36 | 16.5 | £35,000 | 5.0 |
| Education and Tuition | 36 | 17.5 | £9,995 | 5.0 |
| Fitness | 32 | 17.5 | £85,500 | 1.5 |
These are structural comparisons. They should not be read as a league table of better or worse franchise sectors.
UK originated and international brands look different in the Index
| Group | Networks | Median Assess | Min. investment sample | Median minimum |
|---|---|---|---|---|
| UK origin | 659 | 17.0 | 285 | £19,950 |
| Non UK origin | 153 | 18.0 | 71 | £35,000 |
| International brand | 232 | 18.0 | 114 | £31,250 |
International brands and UK originated networks are not directly interchangeable populations. Differences can reflect sector mix, maturity, capital structure and the availability of public evidence. The table is descriptive only.
Assess has a moderate association with observed network scale
Among the 171 networks with a usable approximate location count, Assess Score and location count have a Spearman association of ρ=0.55. Among 325 networks with a usable approximate franchisee count, the association is ρ=0.37.
These relationships do not establish that a higher Assess Score causes a network to become larger. Larger and more mature networks may also have more evidence available to assess.
What “proven” can and cannot mean here
- A larger network is evidence that a model has been replicated, but not proof that every franchisee is profitable.
- A higher Assess Score summarises the Five Fibre assessment evidence, but does not certify financial returns.
- Approximate location and franchisee counts are treated as approximate, not audited totals.
Readiness and infrastructure move closely together
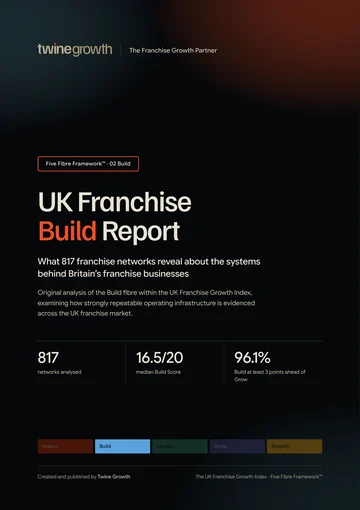
Assess and Build have a Spearman correlation of ρ=0.96 across all 817 networks.
391 networks have exactly the same Assess and Build score. 738 (90.3%) sit within one point. This is one of the strongest patterns in the dataset.
It should not be interpreted as proof that readiness causes operational infrastructure. The two scores are derived from related evidence within the same Five Fibre assessment process.
Assess is connected to the rest of the system
| Compared with Assess | Spearman ρ | p value |
|---|---|---|
| Build | 0.96 | <1e-300 |
| Launch | 0.91 | 2.5e-310 |
| Grow | 0.87 | 4.3e-252 |
| Amplify | 0.93 | <1e-300 |
| Overall | 0.96 | <1e-300 |
Assess is most closely associated with the overall Five Fibre score and Build within this dataset. That is expected to some degree because the fibres form parts of the same 100 point framework. The correlations are useful for describing alignment, not causation.
Important questions the master Index does not answer consistently
This report deliberately asks difficult questions about economics, founder independence, ideal franchisee fit, market evidence and territory readiness. The master Index does not contain structured fields for all of those questions.
- Actual franchisee profitability, margin, break even or payback
- Working capital and full startup cost breakdown
- Ongoing management fees and marketing levies
- Whether the business can genuinely operate for 30 days without its founder
- Detailed ideal franchisee skills and suitability criteria
- Independent market size and demand evidence
- Territory methodology and territory economics
- Whether “proven model” claims are supported by specific public evidence
Not captured is not the same as zero. Not publicly identifiable is not the same as absent.
A future supplementary research layer could code those questions network by network. This edition does not estimate them or convert missing evidence into negative scores.
Ten numbers that describe Assess in Britain
- 01817 franchise networks are included in the master Index used for this report.
- 02The median Assess Score is 17.5/20 and the mean is 16.5/20.
- 03263 of 817 networks (32.2%) score 18–20 on Assess.
- 04809 of 817 networks (99.0%) are recorded as actively recruiting, recruiting, limited, selective or recruiting UK area developers.
- 05A minimum investment is recorded for 359 of 817 networks (43.9%).
- 06The median recorded minimum investment is £21,000, based on 359 networks.
- 07191 of 359 networks with a recorded minimum (53.2%) are below £25,000.
- 08Among 322 networks with usable founding and franchising dates, the median pre franchise trading period is 4 years.
- 09111 of those 322 networks (34.5%) began franchising within one year of founding.
- 10738 of 817 networks (90.3%) have Assess and Build scores within one point.
One in three dated networks began franchising within a year
111 of 322 UK franchise networks with identifiable founding and franchising start dates (34.5%) began franchising within one year of the underlying business being founded.
Why this matters: it shows there is no single long incubation period before franchising across the UK market. Some businesses move from founding to franchising quickly, while more than a quarter of the dated sample traded for 11 years or more first.
What it does not mean: the statistic does not establish that franchising quickly is good or bad, or that the business was commercially ready at the point it franchised.
Methodology
How the research was calculated
The analysis population is 817 franchise networks in the master UK Franchise Network Index. The Index was assessed by Twine Growth and carries a data cut off of 22 September 2026.
- Assess, Build, Launch, Grow, Amplify and Overall Five Fibre scores are used exactly as recorded in the master Index.
- Recruitment status is treated as active for Active, Recruiting, Limited, Selective and Recruiting UK Area Developers.
- Investment statistics use numeric values recorded in Investment From and Investment To. Missing values remain missing.
- Pre Franchise Trading Period is Franchising Started year minus Founded year. Only plausible non negative intervals up to 150 years are included.
- Where a year field contains wording such as “1986 in UK”, the identifiable four digit year is used.
- Approximate franchisee and location counts are used only where a usable number can be extracted. They remain approximate.
- Associations use Spearman rank correlation because several measures are ordinal, bounded or non normally distributed.
- Percentages always use the stated valid denominator rather than silently treating missing information as zero.
- No supplementary live website audit was added to the master Index for this edition.
Research integrity
This report distinguishes recorded Index data, Twine Growth calculations and interpretation. It does not convert promotional earnings claims into verified performance and does not infer profitability, founder independence or franchisee returns where the data cannot establish them.
This report uses the shared Index methodology, set out in full in how the UK Franchise Growth Index was created, plus the report-specific method above.
For journalists
- Report
- UK Franchise Assess Report
- Publisher
- Twine Growth
- Publication date
- 30 September 2026
- Research source
- The UK Franchise Growth Index
- Research population
- 817 networks
- Sample for this report
- 817 networks (every network in the Index)
- Data snapshot
- 22 September 2026
- Methodology
- Methodology for this report and the Index methodology
- Permanent link
- https://www.twinegrowth.com/uk-franchise-growth-index/reports/uk-franchise-assess-report/
- Media enquiries
- Contact Twine Growth
Source: Twine Growth, the UK Franchise Growth Index
Suggested attribution
“According to the UK Franchise Assess Report published by Twine Growth, 34.5% of the 322 UK franchise networks where both dates could be established began franchising within one year of the underlying business being founded.”
The territory this report owns
What needs to be true before a successful business is genuinely ready to become a franchise?
Assess owns the question that comes before Build, Launch, Grow and Amplify: is the underlying model worth scaling?
Corrections and updates
- Published
- 30 September 2026
- Last updated
- 1 October 2026
- Version
- 1.0 (PDF version 1.0)
- Data snapshot
- 22 September 2026
No corrections have been issued for this edition.
If you represent a franchise network and something in this report is wrong or out of date, send us the evidence and we will review it. Corrections are recorded here, and the page address never changes.