Executive summary
The Index exposes a consistent growth gap
The Index does not say that 816 networks are bad at growth. It says Grow is the area with the least publicly verifiable evidence under the scoring method used. Private systems, pipeline data and conversion performance may exist without being visible publicly.
Why the Index exists
One structured view of a fragmented market
UK franchise information is spread across franchisor websites, directories, membership listings, company pages, recruitment material and professional profiles. Looking at any one source shows only part of the picture.
Twine Growth built the UK Franchise Growth Index to bring that public evidence into one consistent structure. Each network is recorded against the same core fields and assessed through the same Five Fibre Framework™. That makes comparison possible without pretending that every franchise publishes the same amount of information.
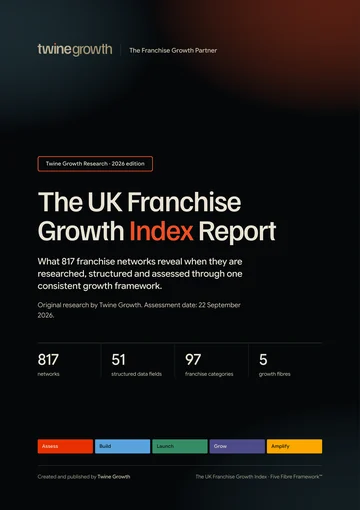
This report analyses the Index itself: how it was built, what it contains, where public evidence is strongest or weakest, and what becomes visible when 817 networks are viewed through one methodology.
The Index at a glance
The master Index contains network identity, classification, headquarters, origin, maturity, network scale, recruitment status, investment, operating model, leadership, professional profiles, research sources, confidence and Five Fibre scoring fields.
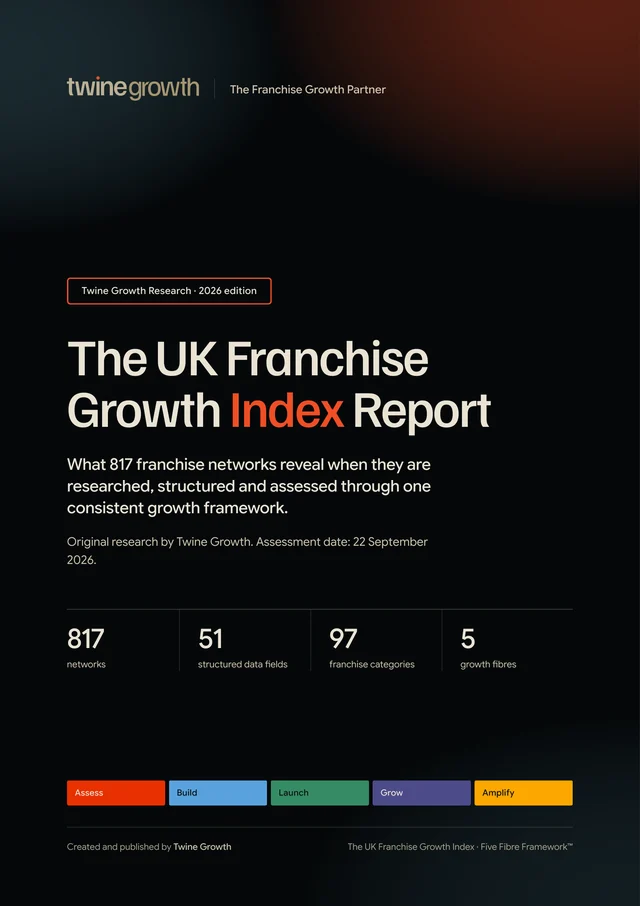
All 817 records contain a score for Assess, Build, Launch, Grow and Amplify, plus an overall Five Fibre score and written review. The assessment date recorded across the Index is 22 September 2026.
Key findings
Grow is the lowest scoring Five Fibre area for 816 of the 817 franchise networks assessed by Twine Growth.
Every one of the 817 networks in the Index scores lower on Grow than on Build under the public evidence based Five Fibre methodology.
Amplify scores higher than Grow for 815 of 817 networks, separating visible local franchisee support from visible recruitment growth infrastructure.
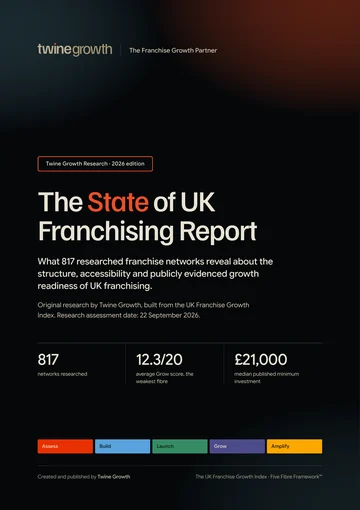
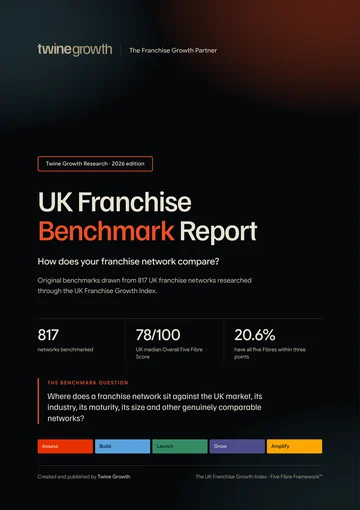
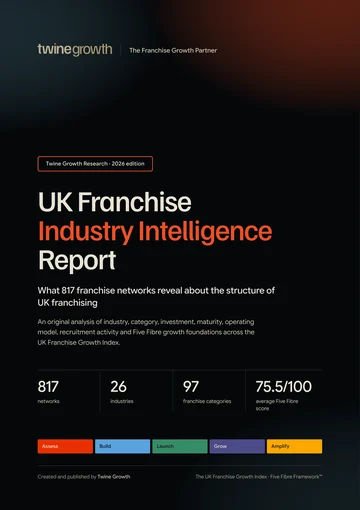
The average overall Five Fibre score across all 817 networks is 75.5/100, with a median of 78/100.
809 of 817 Index records show an active, recruiting, selective or limited recruitment status at the assessment date.
Among 359 networks with a numeric published minimum investment, the median entry figure is £21,000.
More findings from the report
- 58.2%Among those same 359 records, 58.2% have a published minimum investment of £25,000 or below.
- 39.9%Of 336 networks with a usable franchising start year, 39.9% began franchising in 2016 or later.
- 42.5%Of 325 networks with a usable approximate franchisee count, 42.5% have fewer than 50 franchisees.
- 44.1%Only 44.1% of the 817 records contain a publicly identifiable franchise director under the Index research rules.
Every finding is from Twine Growth’s analysis of the UK Franchise Growth Index. The base for each figure is stated in the finding itself.
Ten findings
How the Index was built
Networks were found across multiple UK franchise directories, franchise websites, franchisor websites and other publicly accessible sources.
Each network was researched individually using public evidence rather than relying on a single directory record.
Names, websites and franchise propositions were sense checked to reduce duplicate entries where the same network appeared in different sources or under different naming conventions.
Networks were placed into a consistent Industry, Franchise Category and Sub Industry structure.
Public evidence was assessed across Assess, Build, Launch, Grow and Amplify using the same framework.
Sources, last verified information and a research confidence rating were recorded to make the dataset auditable and updateable.
Boundaries
What qualifies for inclusion
- A franchise network with evidence of a UK franchise presence or UK franchise opportunity.
- A recognisable franchise proposition that can be tied to a specific brand or network.
- Sufficient public evidence to create a distinct record and assess it consistently.
Excluded or held back
- Businesses with no credible evidence of a franchise proposition.
- Duplicate records for the same network after name and website checks.
- Opportunities that could not be tied confidently to a distinct network.
- Claims that could not be supported from public information are not treated as established facts.
What the Index contains
The visible market is far broader than the household names
Food and Drink is the largest industry in the Index with 163 networks, followed by Childcare and Children’s Activities with 115, Business Consultancy, Services and Support with 69, and Cleaning Services with 66. Across the complete Index there are 26 industries, 97 franchise categories and 208 sub industries.
The long tail
Smaller networks are a material part of the researched landscape
Among the 325 records where a usable approximate franchisee count could be extracted, 42.5% have fewer than 50 franchisees. That matters because a directory led view of franchising can naturally overrepresent the most visible national brands.
This is not a claim that 42.5% of every UK franchise network has fewer than 50 franchisees. It is the finding within the subset of Index records where public evidence provided a usable count.
Maturity
Four in ten dated records began franchising within the last decade
Of the 336 networks where the public record yielded a usable franchising start year, 39.9% began franchising in 2016 or later. Nearly one quarter, 24.7%, began in 2021 or later.
The missing data is as important as the finding: a usable start year could not be extracted for 481 Index records. That limits any attempt to generalise this maturity profile to all 817 networks.
Recruitment
Recruitment competition is almost universal in the Index
Active, Recruiting, Selective, Limited and Recruiting UK Area Developers statuses together account for 809 of the 817 records. The Index therefore captures a market in which a very large number of networks are simultaneously seeking some form of franchise growth.
Recruitment status describes publicly visible intent at the assessment date. It does not measure enquiry volume, lead quality, conversion rate or whether a network is currently awarding territories.
Operating models
Franchising is not one operating model
Executive and management models are common in the Index, while more than half of records are marked as home based. Operating model flags are deliberately non exclusive because a franchise can fit more than one description.
Investment landscape
The median visible entry point is £21,000
Among the 359 records with a numeric Investment From figure, 96 are £10,000 or below, 209 are £25,000 or below, 280 are £50,000 or below and 311 are £100,000 or below.
These figures describe published minimum investment, not total capital required. They should not be interpreted as the complete cost of opening or operating a franchise.
The Five Fibre Framework™
Five connected foundations, scored in the same order
The Index score is an external assessment of publicly evidenced foundations. It is not a profitability score, franchisee satisfaction measure, investment recommendation or prediction of future performance.
Five Fibre benchmark
The sharpest drop appears at Grow
Assess averages 16.5, Build 16.5, Launch 15.5, Grow 12.3 and Amplify 14.6. The average gap between Build and Grow is 4.2 points on a 20 point scale.
The Five Fibre disconnect
Grow is the outlier, not a marginal weakness
The consistency of the pattern is more notable than the average itself. Grow is the lowest scoring fibre for 816 networks. It scores below both Build and Assess for all 817 networks.
Amplify is higher than Grow for 815 networks. In the Index methodology, public evidence around local marketing and franchisee support is therefore usually more visible than evidence around the repeatable franchise recruitment engine.
Overall score distribution
The middle of the Index sits in the 70s and 80s
The average overall Five Fibre score is 75.5/100 and the median is 78/100. Scores range from 45 to 98. The distribution is more useful than a single average because it shows how widely publicly evidenced foundations vary across the Index.
Industry comparison
Industry differences exist, but sample size matters
Among industries with at least 20 Index records, average overall scores vary materially. The chart is useful as a benchmark of publicly evidenced growth foundations, but should not be treated as a league table of industry attractiveness or franchise quality.
Investment versus growth foundations
A higher entry price is not a strong proxy for a higher Index score
Across records with a numeric minimum investment, the Pearson correlation between minimum investment and overall Five Fibre score is approximately 0.13. That is a weak positive relationship.
The Index therefore does not support treating a higher published entry price as a reliable shorthand for stronger publicly evidenced growth foundations. Correlation does not establish causation, and investment figures are incomplete for many networks.
Public information benchmark
Some of the most useful franchise facts are the hardest to verify
A franchise opportunity URL is available for 57.0% of records, but a franchising start date is recorded for only 44.6%. A named franchise director is publicly identifiable in 44.1% of records and a LinkedIn profile for that role in 19.8%.
Research confidence
Confidence records the evidence, not the quality of the franchise
The confidence field describes how complete and dependable the public evidence was for the record. It is not a score for the franchise itself. A low confidence record may simply reflect limited public disclosure.
What surprised us
Four findings that only emerge when the records sit together
816 of 817 networks have Grow as their lowest fibre.
Amplify scores above Grow for 815 networks.
The correlation between minimum investment and overall Five Fibre score is only about 0.13 among records with numeric investment data.
Only 336 records yield a usable franchising start year, despite the Index containing 817 researched networks.
What the Index challenges
Visibility, scale and price are not the same thing as growth readiness
- A well known brand is not the only useful lens. The Index contains hundreds of smaller and lesser known networks that become visible once multiple sources are combined.
- Recruiting franchisees and supporting franchisees are different growth jobs. The Grow and Amplify scores make that distinction measurable.
- A higher minimum investment does not strongly track with a higher Five Fibre score in the available data.
- Missing public information should not be converted into a negative claim about an internal system. The Index separates public evidence from private reality.
What the Index cannot tell us
This is a research resource, not an investment recommendation
- It cannot establish franchisee profitability from public evidence alone.
- It cannot measure franchisee satisfaction unless robust comparable evidence exists.
- It cannot determine whether a specific franchise is suitable for a particular prospective franchisee.
- It cannot see private systems, internal dashboards, lead volumes, conversion rates or support processes that are not publicly disclosed.
- It should not be used as a simplistic best and worst franchise league table.
Methodology
How to read the research
Research base: 817 franchise networks in the master UK Franchise Networks Index.
Evidence basis: Publicly available information researched at network level and recorded into a consistent structure.
Assessment date: 22 September 2026.
Scoring: Each network is scored out of 20 across Assess, Build, Launch, Grow and Amplify, producing an overall score out of 100.
Missing evidence: Where information could not be verified publicly, the Index uses explicit no public record or not publicly available wording rather than assuming a fact.
Confidence: High, Medium and Low confidence describe the strength and completeness of the public research record, not the quality of the franchise.
Comparisons: Every statistic in this report states or implies its relevant base. Subset analysis is not presented as if it covers all 817 networks.
Originality and publication check
Original analysis, with restrained claims
The findings in this report were calculated from Twine Growth’s proprietary master Index rather than copied from third party franchise market reports. Before publication, headline themes were checked against public web results for materially similar UK franchise research.
Those checks found Twine Growth’s own public Five Fibre Framework pages, but did not surface a materially identical public benchmark analysing more than 800 UK franchise networks across Assess, Build, Launch, Grow and Amplify. That supports describing the calculations as original Twine Growth analysis.
The report does not claim “first ever”, “largest” or “only” unless Twine Growth can independently substantiate that wording at the point of publication. Public search cannot prove that no similar analysis has ever existed.
Transparency
Corrections, updates and version control
- Franchise information changes. Networks launch, rebrand, recruit, pause recruitment, change leadership and publish new evidence. The Index should therefore be treated as a dated research record rather than a permanent statement about any network.
- Networks have a clear route to submit updated public evidence or request a factual review.
- Material corrections are logged rather than silently rewriting a historical published report.
- Future editions will carry a new publication date and version number so year on year comparisons remain auditable.
- The master database remains proprietary. Selected aggregate tables can be shared with journalists to help them verify calculations without exposing the complete source dataset.
This report uses the shared Index methodology, set out in full in how the UK Franchise Growth Index was created, plus the report-specific method above.
For journalists
- Report
- The UK Franchise Growth Index Report
- Publisher
- Twine Growth
- Publication date
- 30 September 2026
- Research source
- The UK Franchise Growth Index
- Research population
- 817 networks
- Sample for this report
- 817 networks (every network in the Index)
- Data snapshot
- 22 September 2026
- Methodology
- Methodology for this report and the Index methodology
- Permanent link
- https://www.twinegrowth.com/uk-franchise-growth-index/reports/uk-franchise-growth-index-report/
- Media enquiries
- Contact Twine Growth
Source: Twine Growth, the UK Franchise Growth Index
For journalists
Everything needed to cite the report
Preferred attribution
“According to the UK Franchise Growth Index Report, published by Twine Growth and based on research from the UK Franchise Growth Index…”
Linking guidance
Publications using findings from the report should link to the permanent report page or live Index as the original source. Twine Growth can provide additional aggregate cuts by industry, category, investment, maturity, operating model and Five Fibre data where the underlying evidence supports them.
About the Index
A living research layer for UK franchise growth
The UK Franchise Growth Index is designed to let users explore franchise networks, industries and categories through a consistent research structure. Its value comes from connection: identity, market classification, maturity, investment, operating model, public evidence and Five Fibre assessment sitting together rather than in separate directories and documents.
About Twine Growth
Twine Growth is The Franchise Growth Partner. Its Five Fibre Framework™ connects Assess, Build, Launch, Grow and Amplify into one approach to building and scaling franchise networks.
The Index and this report are created and published by Twine Growth as original research resources for franchisors, franchise professionals, researchers and journalists.
Corrections and updates
- Published
- 30 September 2026
- Last updated
- 1 October 2026
- Version
- 1.0 (PDF version 1.0)
- Data snapshot
- 22 September 2026
No corrections have been issued for this edition.
If you represent a franchise network and something in this report is wrong or out of date, send us the evidence and we will review it. Corrections are recorded here, and the page address never changes.